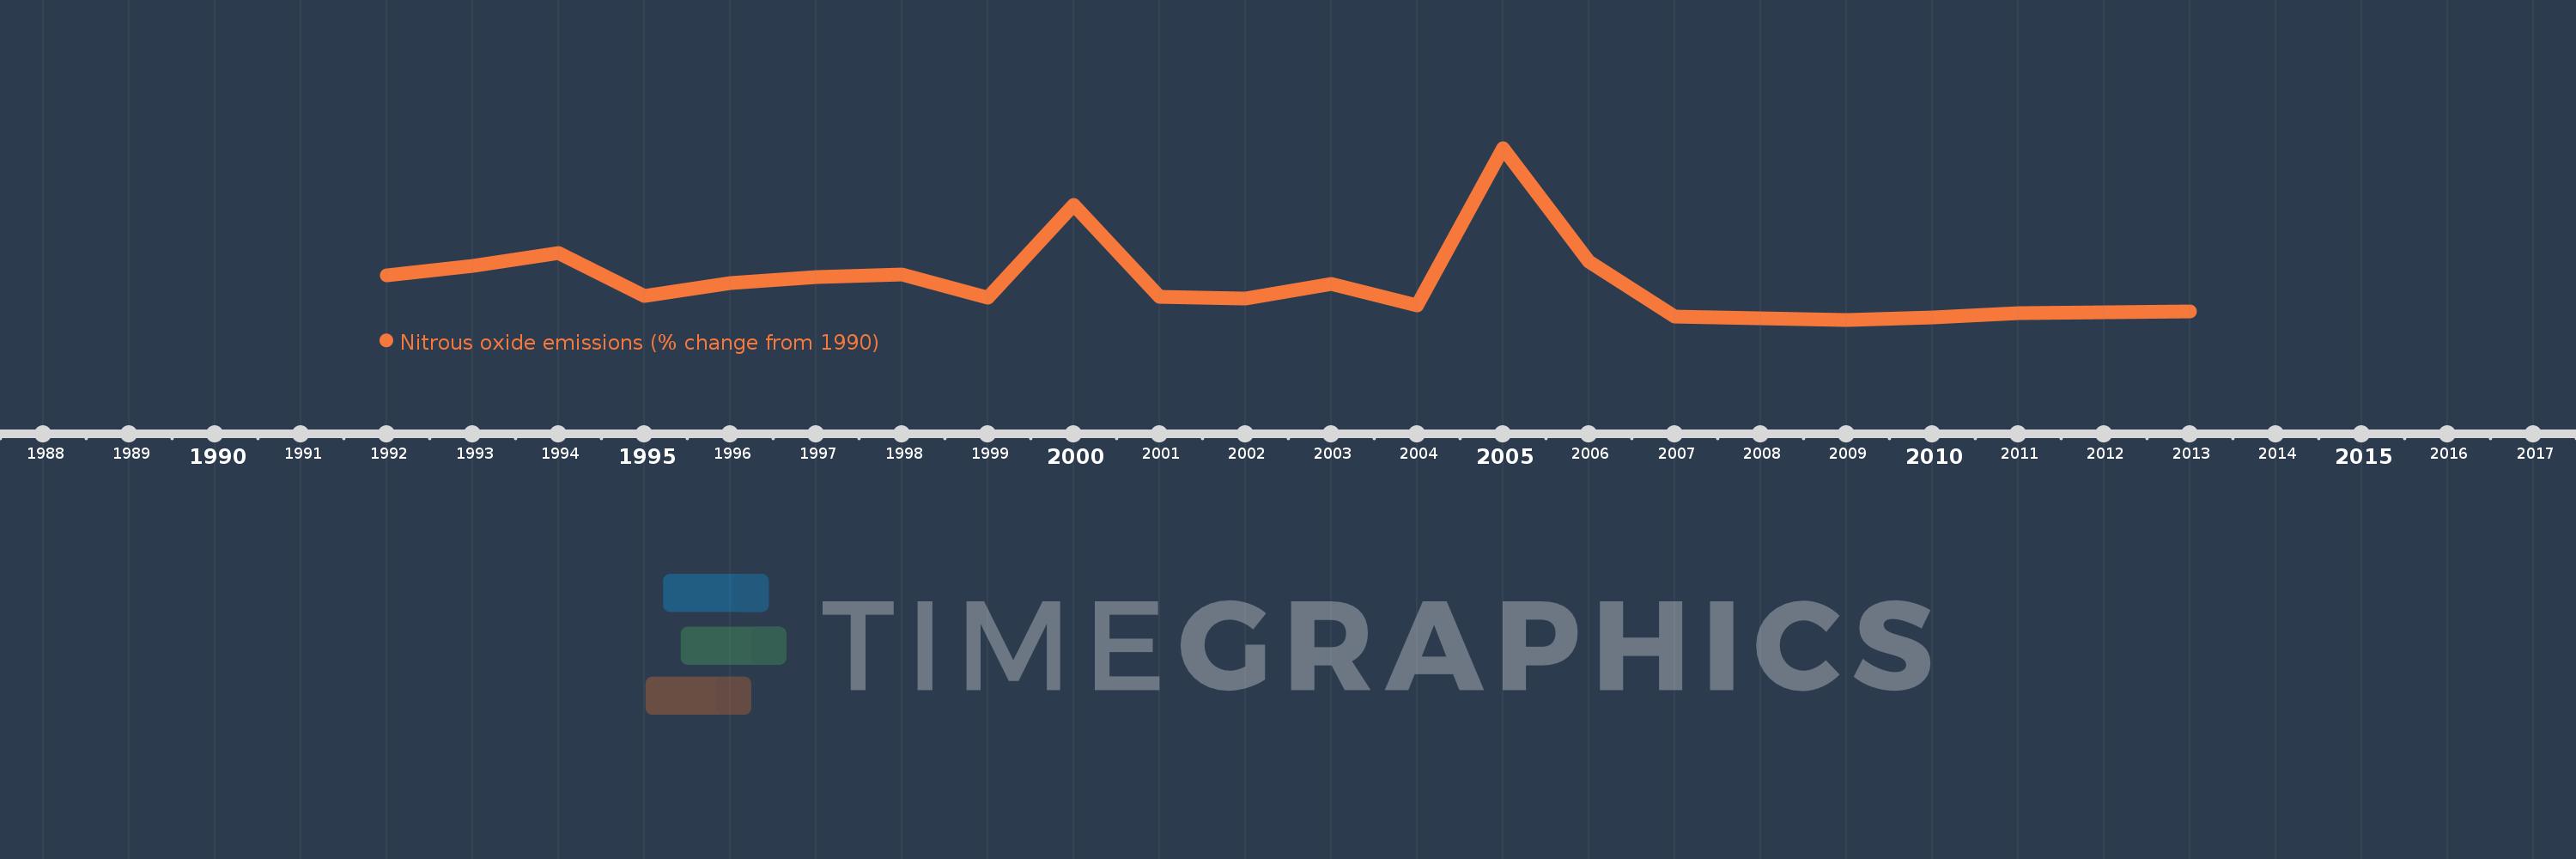
This timeline shows a graph from 1992 to 2013 of Bolivia. No data until 1991. Number of actual observations by date: 22.
Source name:
World Development Indicators
Source organization:
World Bank staff estimates from original source: European Commission, Joint Research Centre (JRC)/Netherlands Environmental Assessment Agency (PBL). Emission Database for Global Atmospheric Research (EDGAR): http://edgar.jrc.ec.europa.eu/.
Categories, topics:
Climate Change, Environment
Last updated:
apr 23, 2017
Indicators value changes by year
Meaning:
-11.939
Minimum:
-39.884
jan 1, 2009
Maximum:
91.394
jan 1, 2005
At the date of observation
Value
Absolute change
Change from the previous value
jan 1, 1992
-5.717
-5.717
0.0%
jan 1, 1993
1.052
+6.769
-118.41%
jan 1, 1994
11.081
+10.029
953.09%
jan 1, 1995
-21.895
-32.976
-297.6%
jan 1, 1996
-11.604
+10.291
-47.0%
jan 1, 1997
-7.465
+4.139
-35.67%
jan 1, 1998
-5.282
+2.183
-29.24%
jan 1, 1999
-23.062
-17.78
336.62%
jan 1, 2000
47.745
+70.807
-307.03%
jan 1, 2001
-22.41
-70.154
-146.94%
jan 1, 2002
-23.611
-1.202
5.36%
jan 1, 2003
-12.384
+11.227
-47.55%
jan 1, 2004
-28.697
-16.313
131.73%
jan 1, 2005
91.394
+120.091
-418.48%
jan 1, 2006
4.592
-86.802
-94.98%
jan 1, 2007
-37.44
-42.032
-915.35%
jan 1, 2008
-38.788
-1.347
3.6%
jan 1, 2009
-39.884
-1.096
2.83%
jan 1, 2010
-38.206
+1.678
-4.21%
jan 1, 2011
-34.677
+3.529
-9.24%
jan 1, 2012
-34.024
+0.653
-1.88%
jan 1, 2013
-33.37
+0.653
-1.92%
Ranking of countries by current statistics by years