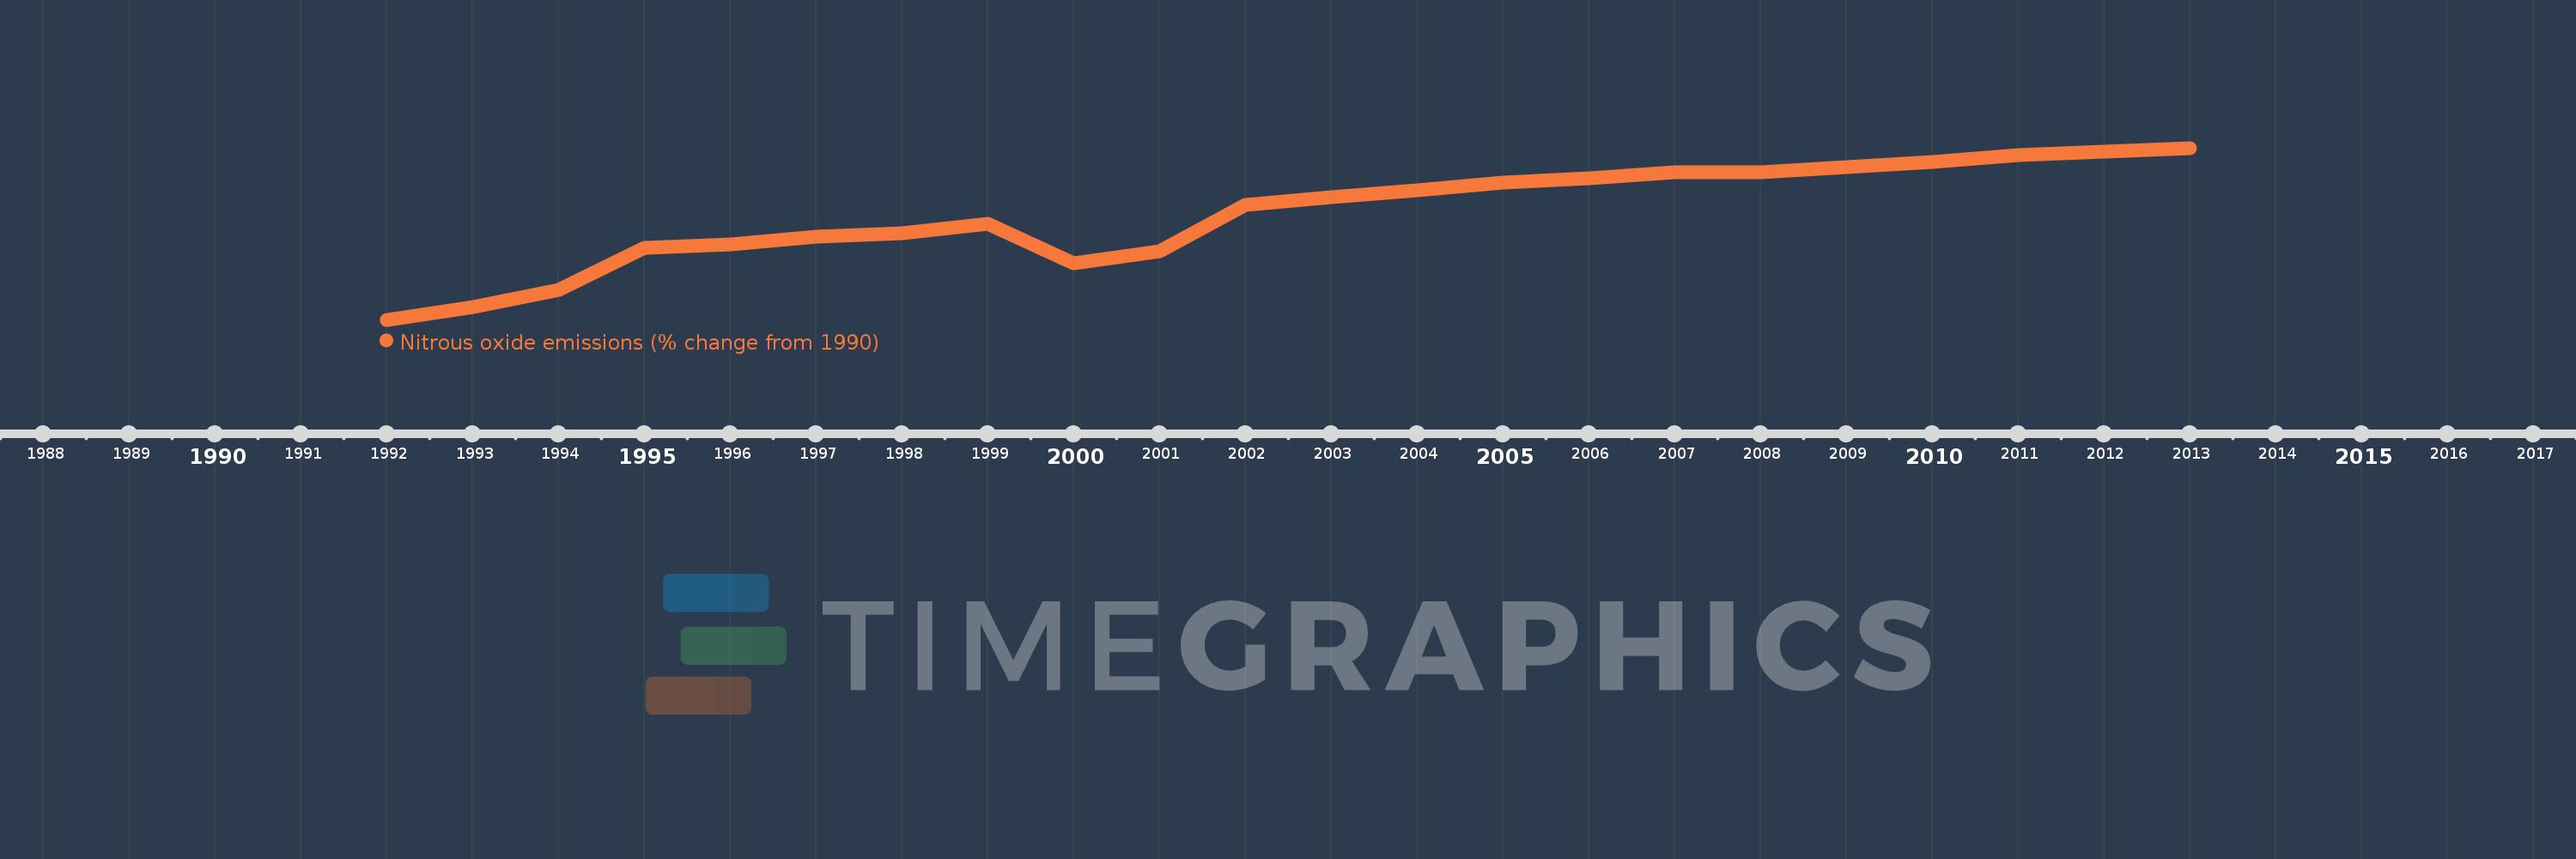
This timeline shows a graph from 1992 to 2013 of Timor-Leste. No data until 1991. Number of actual observations by date: 22.
Source name:
World Development Indicators
Source organization:
World Bank staff estimates from original source: European Commission, Joint Research Centre (JRC)/Netherlands Environmental Assessment Agency (PBL). Emission Database for Global Atmospheric Research (EDGAR): http://edgar.jrc.ec.europa.eu/.
Categories, topics:
Climate Change, Environment
Last updated:
apr 23, 2017
Indicators value changes by year
Meaning:
67.316
Minimum:
10.873
jan 1, 1992
Maximum:
102.206
jan 1, 2013
At the date of observation
Value
Absolute change
Change from the previous value
jan 1, 1992
10.873
+10.873
0.0%
jan 1, 1993
17.713
+6.84
62.91%
jan 1, 1994
26.493
+8.78
49.57%
jan 1, 1995
49.278
+22.785
86.0%
jan 1, 1996
51.115
+1.836
3.73%
jan 1, 1997
54.939
+3.825
7.48%
jan 1, 1998
56.895
+1.956
3.56%
jan 1, 1999
62.042
+5.147
9.05%
jan 1, 2000
40.684
-21.358
-34.43%
jan 1, 2001
47.345
+6.661
16.37%
jan 1, 2002
71.729
+24.384
51.5%
jan 1, 2003
75.839
+4.11
5.73%
jan 1, 2004
79.799
+3.96
5.22%
jan 1, 2005
83.983
+4.184
5.24%
jan 1, 2006
86.094
+2.111
2.51%
jan 1, 2007
89.161
+3.067
3.56%
jan 1, 2008
89.339
+0.178
0.2%
jan 1, 2009
92.098
+2.758
3.09%
jan 1, 2010
94.851
+2.753
2.99%
jan 1, 2011
98.242
+3.39
3.57%
jan 1, 2012
100.224
+1.982
2.02%
jan 1, 2013
102.206
+1.982
1.98%
Ranking of countries by current statistics by years