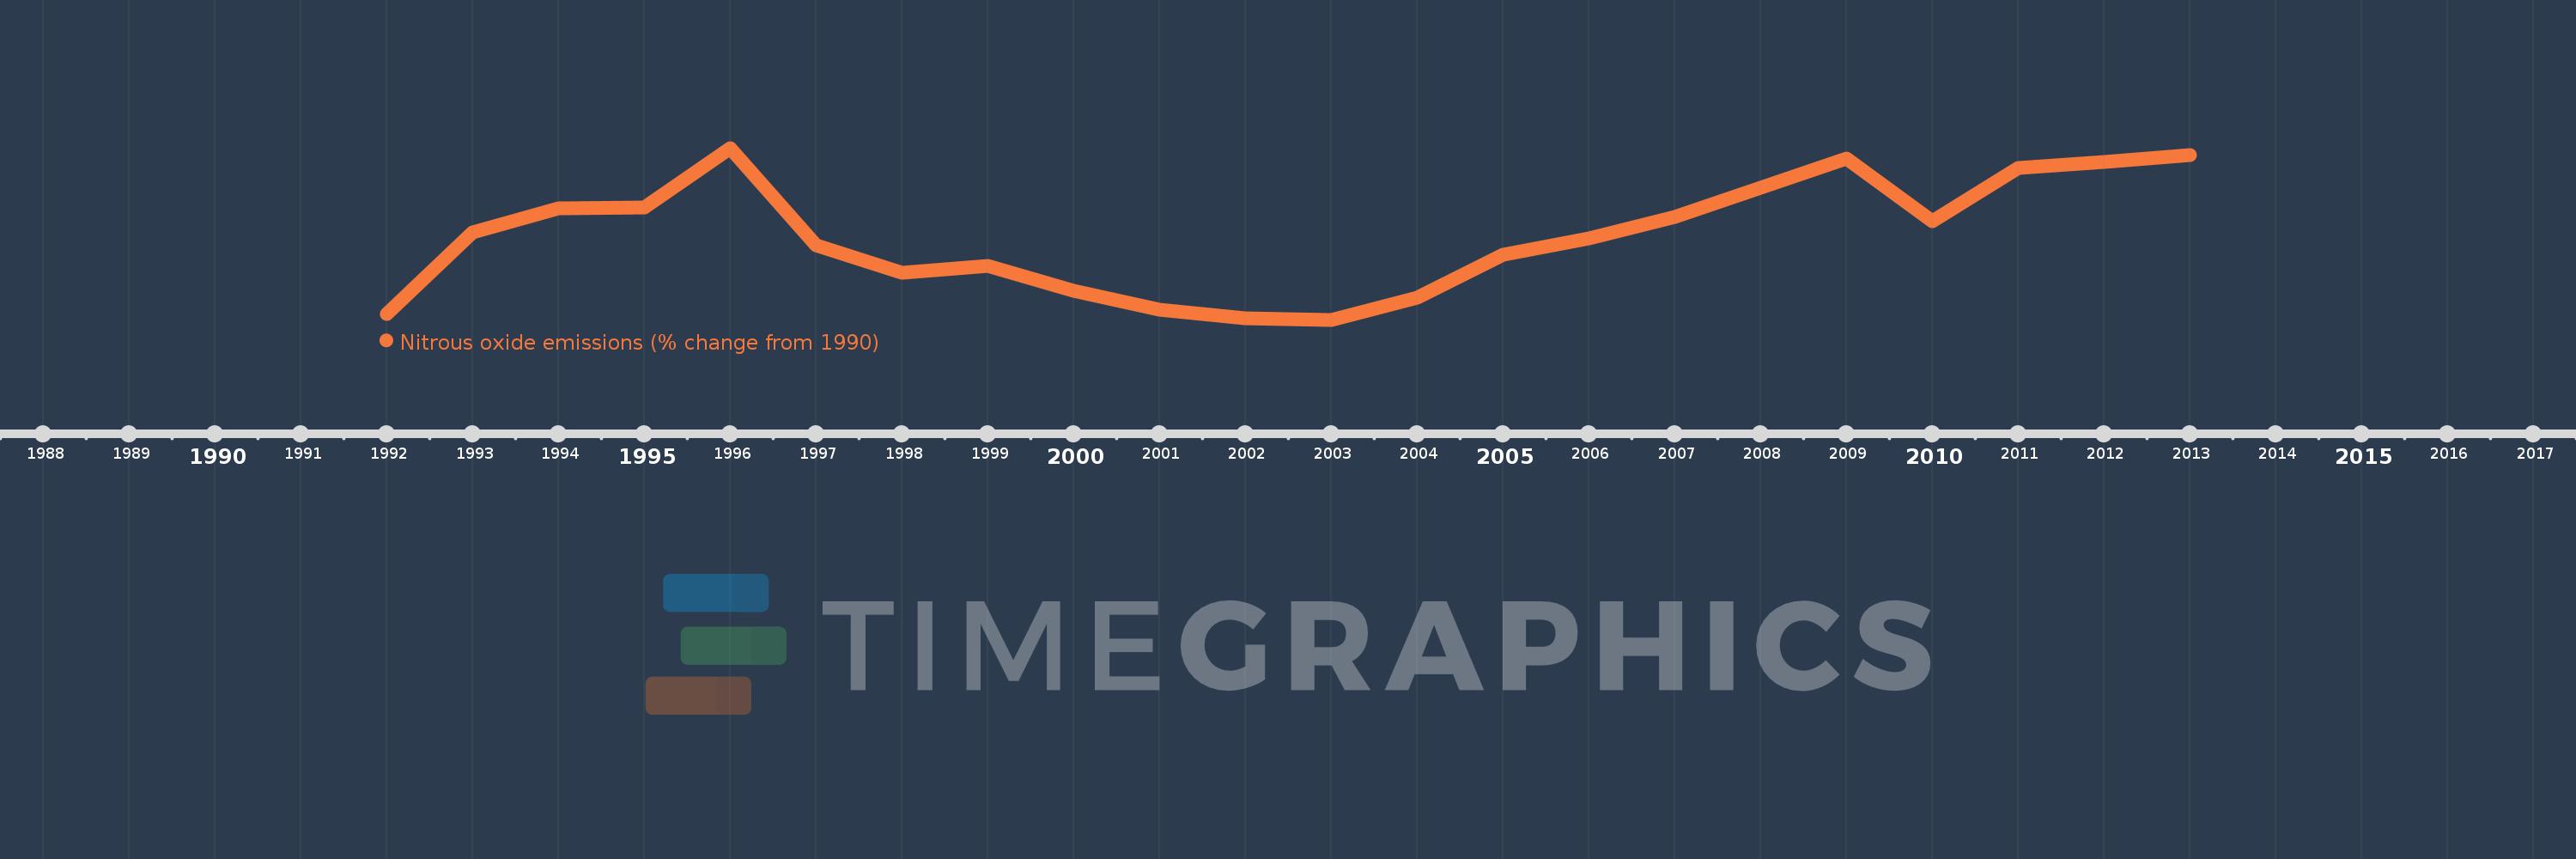
This timeline shows a graph from 1992 to 2013 of Egypt, Arab Rep.. No data until 1991. Number of actual observations by date: 22.
Source name:
World Development Indicators
Source organization:
World Bank staff estimates from original source: European Commission, Joint Research Centre (JRC)/Netherlands Environmental Assessment Agency (PBL). Emission Database for Global Atmospheric Research (EDGAR): http://edgar.jrc.ec.europa.eu/.
Categories, topics:
Climate Change, Environment
Last updated:
apr 23, 2017
Indicators value changes by year
Meaning:
15.576
Minimum:
-1.118
jan 1, 2003
Maximum:
33.156
jan 1, 1996
At the date of observation
Value
Absolute change
Change from the previous value
jan 1, 1992
0.067
+0.067
0.0%
jan 1, 1993
16.245
+16.178
24.15K%
jan 1, 1994
21.129
+4.884
30.06%
jan 1, 1995
21.241
+0.111
0.53%
jan 1, 1996
33.156
+11.916
56.1%
jan 1, 1997
13.729
-19.428
-58.59%
jan 1, 1998
8.182
-5.547
-40.4%
jan 1, 1999
9.645
+1.464
17.89%
jan 1, 2000
4.704
-4.941
-51.23%
jan 1, 2001
0.803
-3.901
-82.93%
jan 1, 2002
-0.742
-1.545
-192.47%
jan 1, 2003
-1.118
-0.375
50.55%
jan 1, 2004
3.246
+4.363
-390.41%
jan 1, 2005
11.891
+8.645
266.36%
jan 1, 2006
15.149
+3.258
27.4%
jan 1, 2007
19.367
+4.219
27.85%
jan 1, 2008
25.261
+5.894
30.43%
jan 1, 2009
31.004
+5.743
22.73%
jan 1, 2010
18.501
-12.503
-40.33%
jan 1, 2011
29.113
+10.612
57.36%
jan 1, 2012
30.404
+1.291
4.43%
jan 1, 2013
31.695
+1.291
4.25%
Ranking of countries by current statistics by years