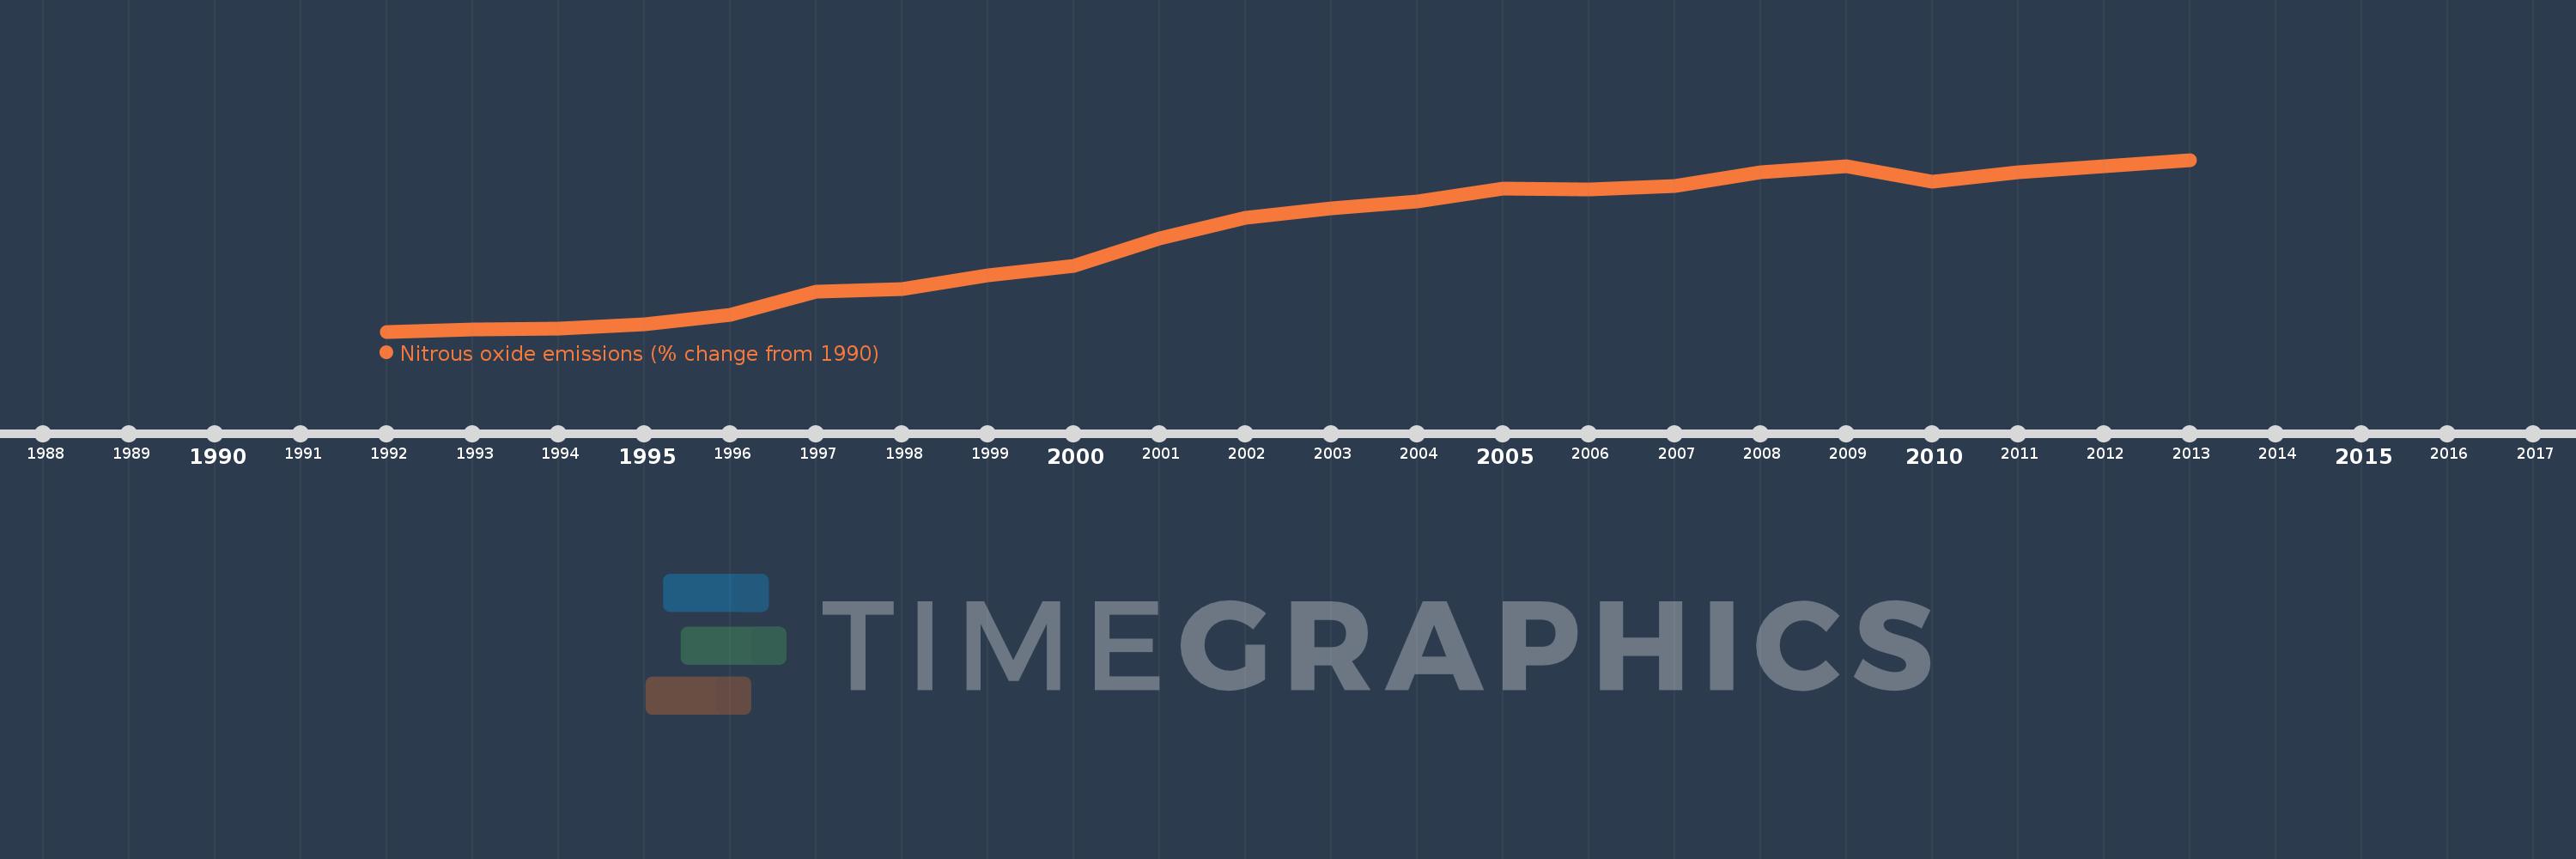
This timeline shows a graph from 1992 to 2013 of Kiribati. No data until 1991. Number of actual observations by date: 22.
Source name:
World Development Indicators
Source organization:
World Bank staff estimates from original source: European Commission, Joint Research Centre (JRC)/Netherlands Environmental Assessment Agency (PBL). Emission Database for Global Atmospheric Research (EDGAR): http://edgar.jrc.ec.europa.eu/.
Categories, topics:
Climate Change, Environment
Last updated:
apr 23, 2017
Indicators value changes by year
Meaning:
25.512
Minimum:
3.263
jan 1, 1992
Maximum:
43.393
jan 1, 2013
At the date of observation
Value
Absolute change
Change from the previous value
jan 1, 1992
3.263
+3.263
0.0%
jan 1, 1993
3.747
+0.484
14.83%
jan 1, 1994
3.957
+0.211
5.62%
jan 1, 1995
4.897
+0.94
23.76%
jan 1, 1996
7.231
+2.334
47.66%
jan 1, 1997
12.685
+5.454
75.41%
jan 1, 1998
13.258
+0.573
4.52%
jan 1, 1999
16.317
+3.059
23.08%
jan 1, 2000
18.574
+2.257
13.83%
jan 1, 2001
25.112
+6.538
35.2%
jan 1, 2002
29.763
+4.651
18.52%
jan 1, 2003
32.026
+2.262
7.6%
jan 1, 2004
33.727
+1.702
5.31%
jan 1, 2005
36.617
+2.89
8.57%
jan 1, 2006
36.457
-0.16
-0.44%
jan 1, 2007
37.2
+0.743
2.04%
jan 1, 2008
40.459
+3.259
8.76%
jan 1, 2009
41.819
+1.36
3.36%
jan 1, 2010
38.188
-3.631
-8.68%
jan 1, 2011
40.582
+2.393
6.27%
jan 1, 2012
41.987
+1.406
3.46%
jan 1, 2013
43.393
+1.406
3.35%
Ranking of countries by current statistics by years