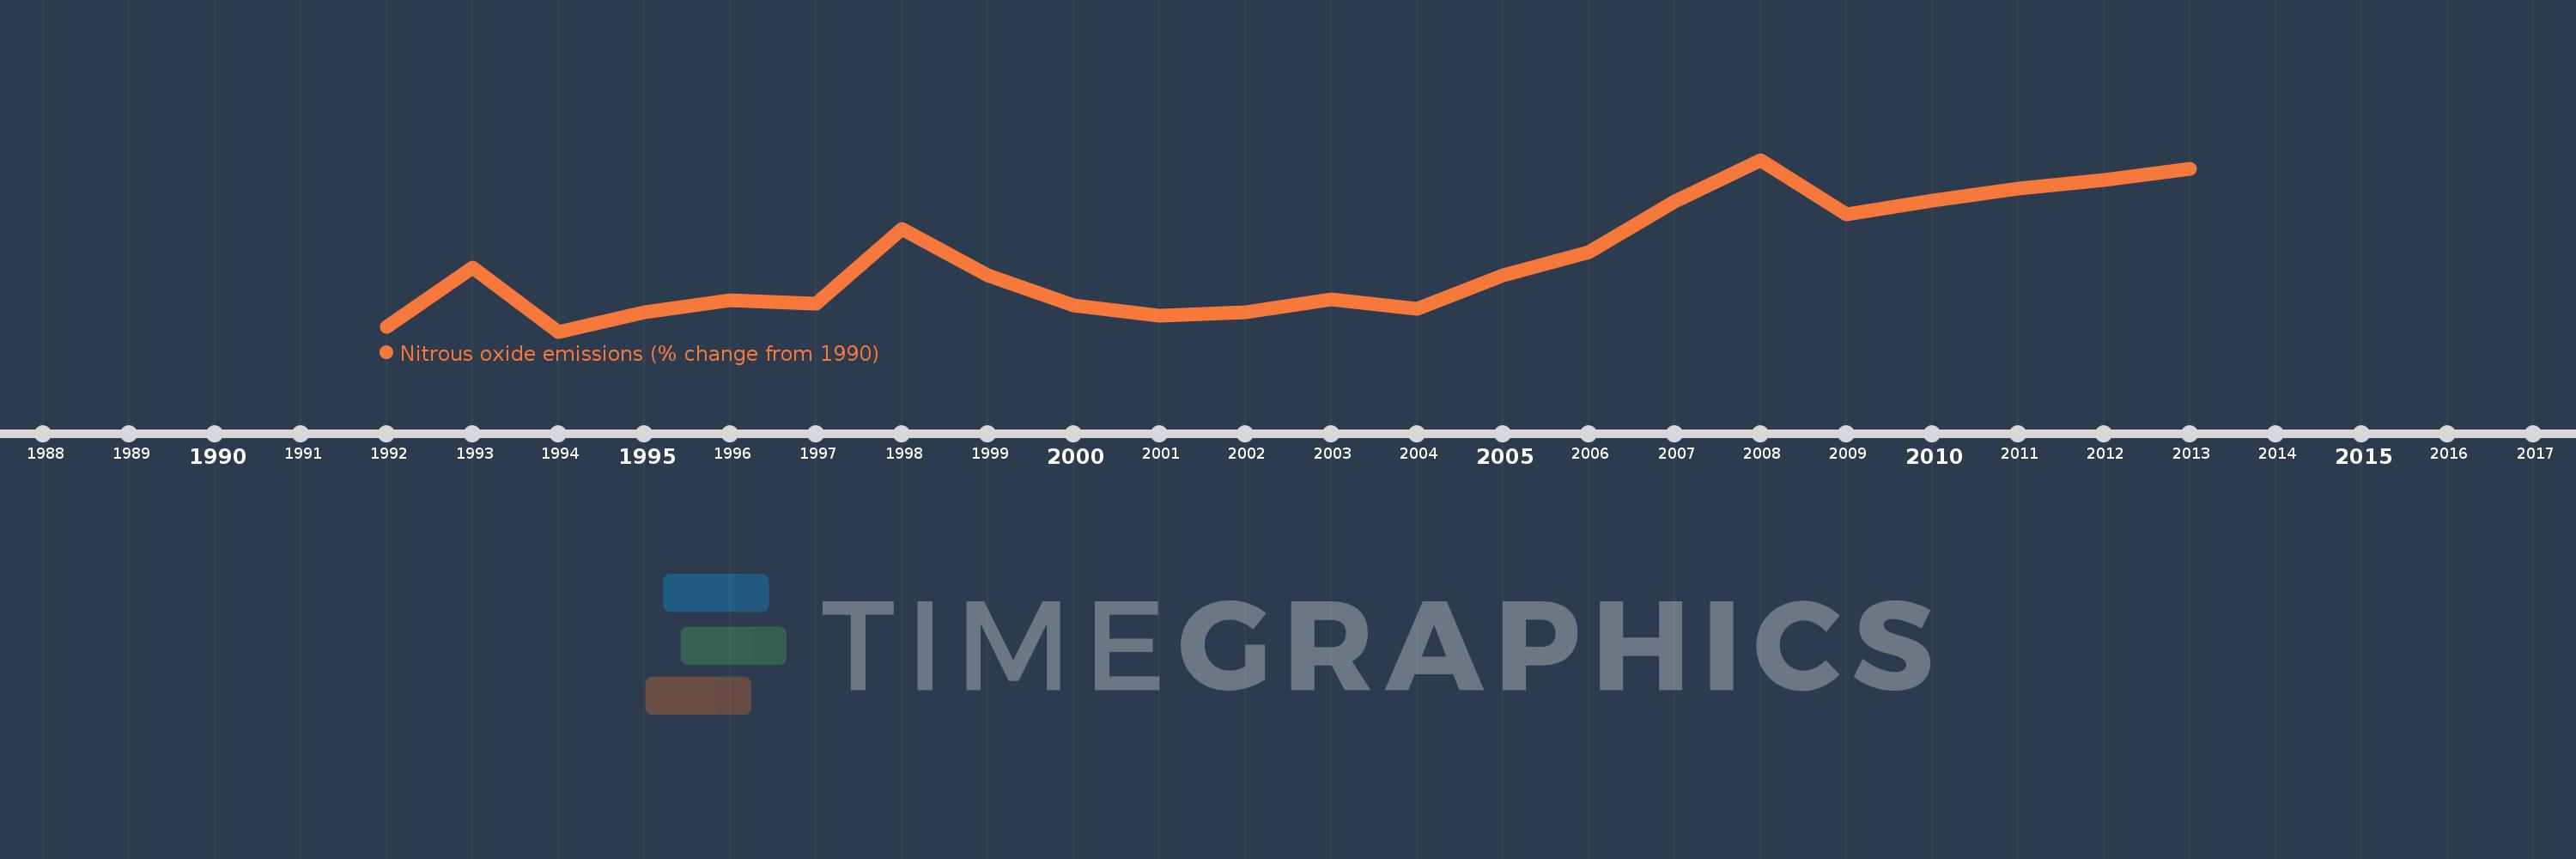
This timeline shows a graph from 1992 to 2013 of Low & middle income. No data until 1991. Number of actual observations by date: 22.
Source name:
World Development Indicators
Source organization:
World Bank staff estimates from original source: European Commission, Joint Research Centre (JRC)/Netherlands Environmental Assessment Agency (PBL). Emission Database for Global Atmospheric Research (EDGAR): http://edgar.jrc.ec.europa.eu/.
Categories, topics:
Climate Change, Environment
Last updated:
apr 23, 2017
Indicators value changes by year
Meaning:
10.715
Minimum:
-2.586
jan 1, 1994
Maximum:
29.541
jan 1, 2008
At the date of observation
Value
Absolute change
Change from the previous value
jan 1, 1992
-1.689
-1.689
0.0%
jan 1, 1993
9.443
+11.132
-659.18%
jan 1, 1994
-2.586
-12.029
-127.39%
jan 1, 1995
0.954
+3.541
-136.9%
jan 1, 1996
3.214
+2.259
236.73%
jan 1, 1997
2.575
-0.638
-19.86%
jan 1, 1998
16.575
+14.0
543.58%
jan 1, 1999
7.975
-8.6
-51.89%
jan 1, 2000
2.238
-5.737
-71.94%
jan 1, 2001
0.311
-1.927
-86.1%
jan 1, 2002
1.108
+0.797
256.11%
jan 1, 2003
3.465
+2.357
212.67%
jan 1, 2004
1.644
-1.821
-52.55%
jan 1, 2005
7.926
+6.282
382.11%
jan 1, 2006
12.283
+4.357
54.96%
jan 1, 2007
21.676
+9.393
76.47%
jan 1, 2008
29.541
+7.865
36.28%
jan 1, 2009
19.375
-10.167
-34.41%
jan 1, 2010
21.991
+2.617
13.51%
jan 1, 2011
24.088
+2.096
9.53%
jan 1, 2012
25.756
+1.668
6.92%
jan 1, 2013
27.867
+2.112
8.2%
Ranking of countries by current statistics by years