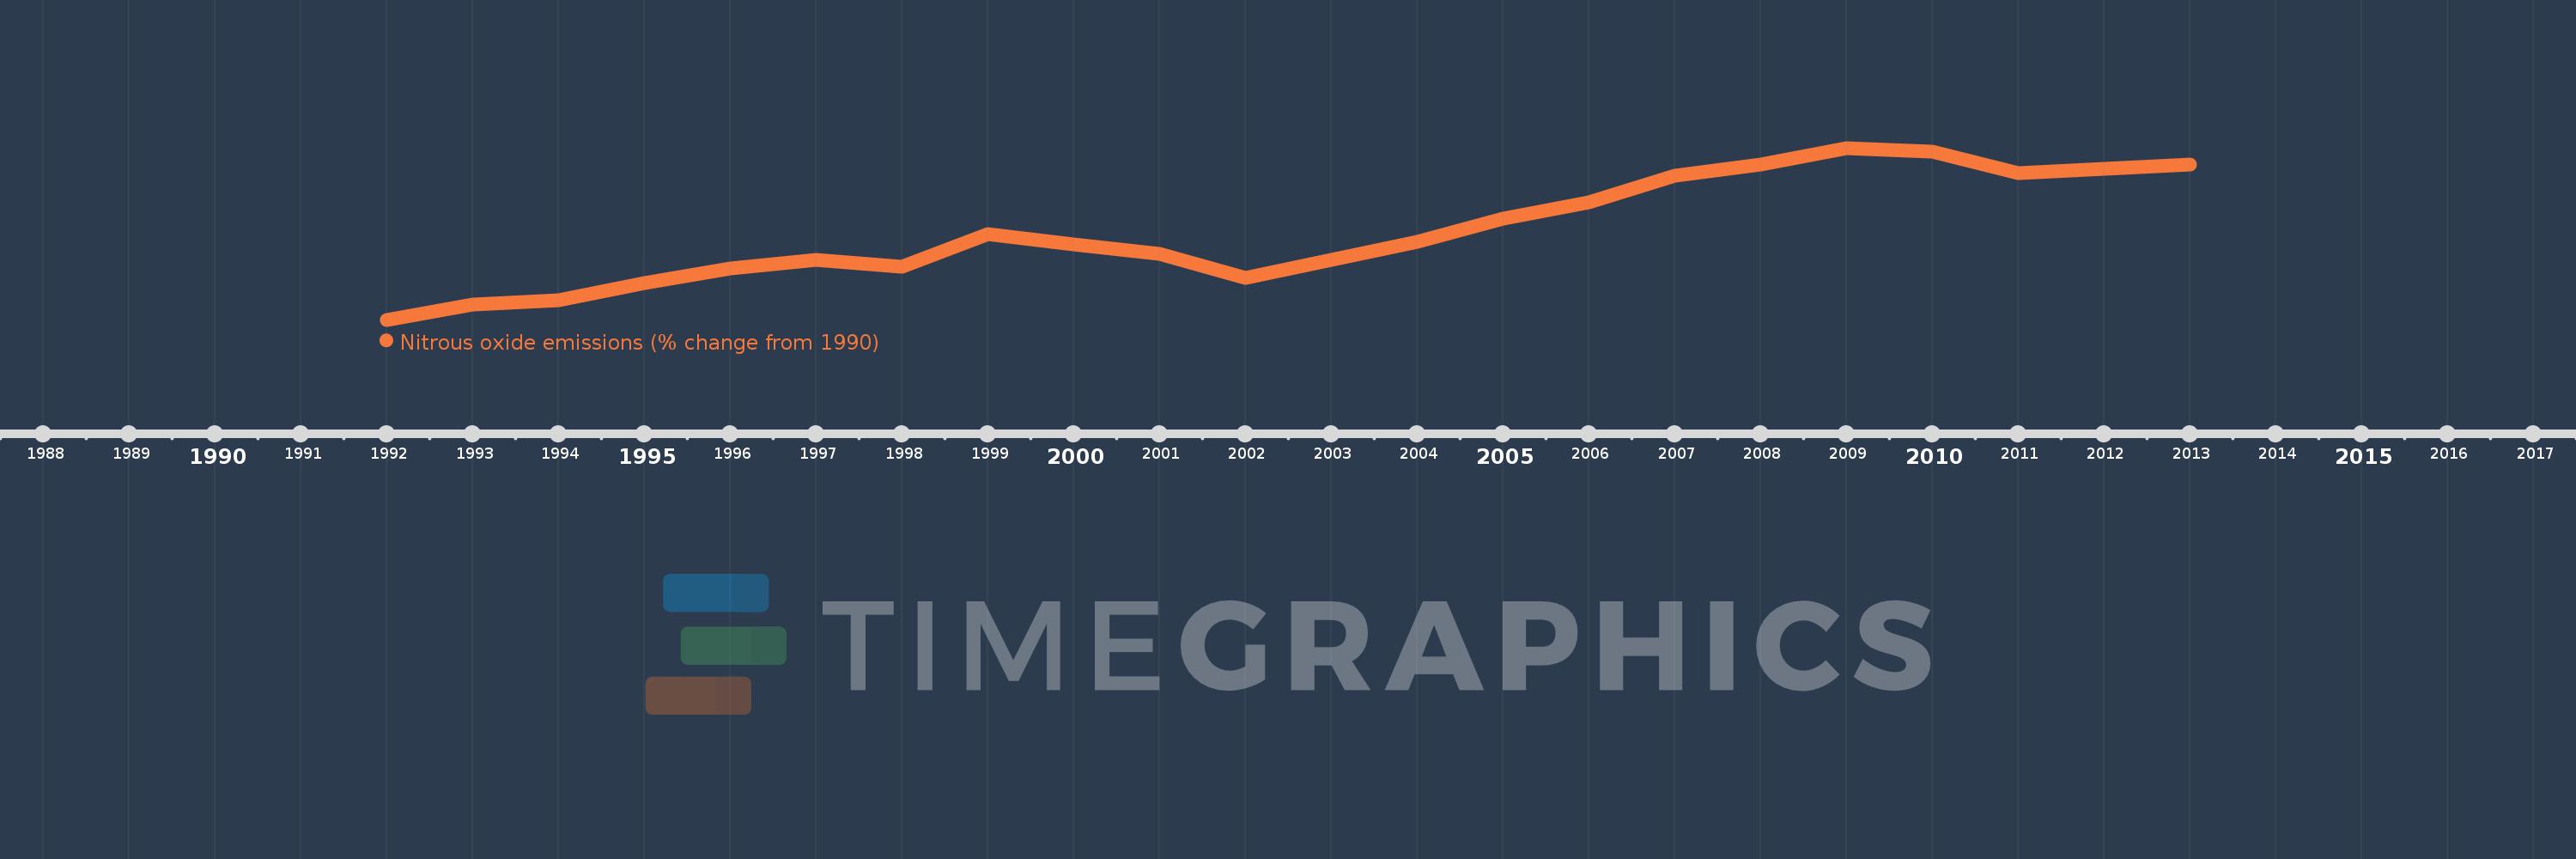
This timeline shows a graph from 1992 to 2013 of Syrian Arab Republic. No data until 1991. Number of actual observations by date: 22.
Source name:
World Development Indicators
Source organization:
World Bank staff estimates from original source: European Commission, Joint Research Centre (JRC)/Netherlands Environmental Assessment Agency (PBL). Emission Database for Global Atmospheric Research (EDGAR): http://edgar.jrc.ec.europa.eu/.
Categories, topics:
Climate Change, Environment
Last updated:
apr 23, 2017
Indicators value changes by year
Meaning:
20.865
Minimum:
-7.266
jan 1, 1992
Maximum:
47.185
jan 1, 2009
At the date of observation
Value
Absolute change
Change from the previous value
jan 1, 1992
-7.266
-7.266
0.0%
jan 1, 1993
-2.381
+4.885
-67.23%
jan 1, 1994
-1.097
+1.284
-53.91%
jan 1, 1995
4.255
+5.352
-487.71%
jan 1, 1996
9.019
+4.765
111.99%
jan 1, 1997
11.658
+2.639
29.26%
jan 1, 1998
9.566
-2.092
-17.95%
jan 1, 1999
19.757
+10.191
106.53%
jan 1, 2000
16.718
-3.039
-15.38%
jan 1, 2001
13.717
-3.0
-17.95%
jan 1, 2002
5.991
-7.726
-56.32%
jan 1, 2003
11.834
+5.843
97.53%
jan 1, 2004
17.533
+5.699
48.15%
jan 1, 2005
24.655
+7.122
40.62%
jan 1, 2006
30.044
+5.389
21.86%
jan 1, 2007
38.453
+8.409
27.99%
jan 1, 2008
41.828
+3.375
8.78%
jan 1, 2009
47.185
+5.357
12.81%
jan 1, 2010
46.052
-1.133
-2.4%
jan 1, 2011
39.114
-6.938
-15.07%
jan 1, 2012
40.505
+1.391
3.56%
jan 1, 2013
41.896
+1.391
3.43%
Ranking of countries by current statistics by years