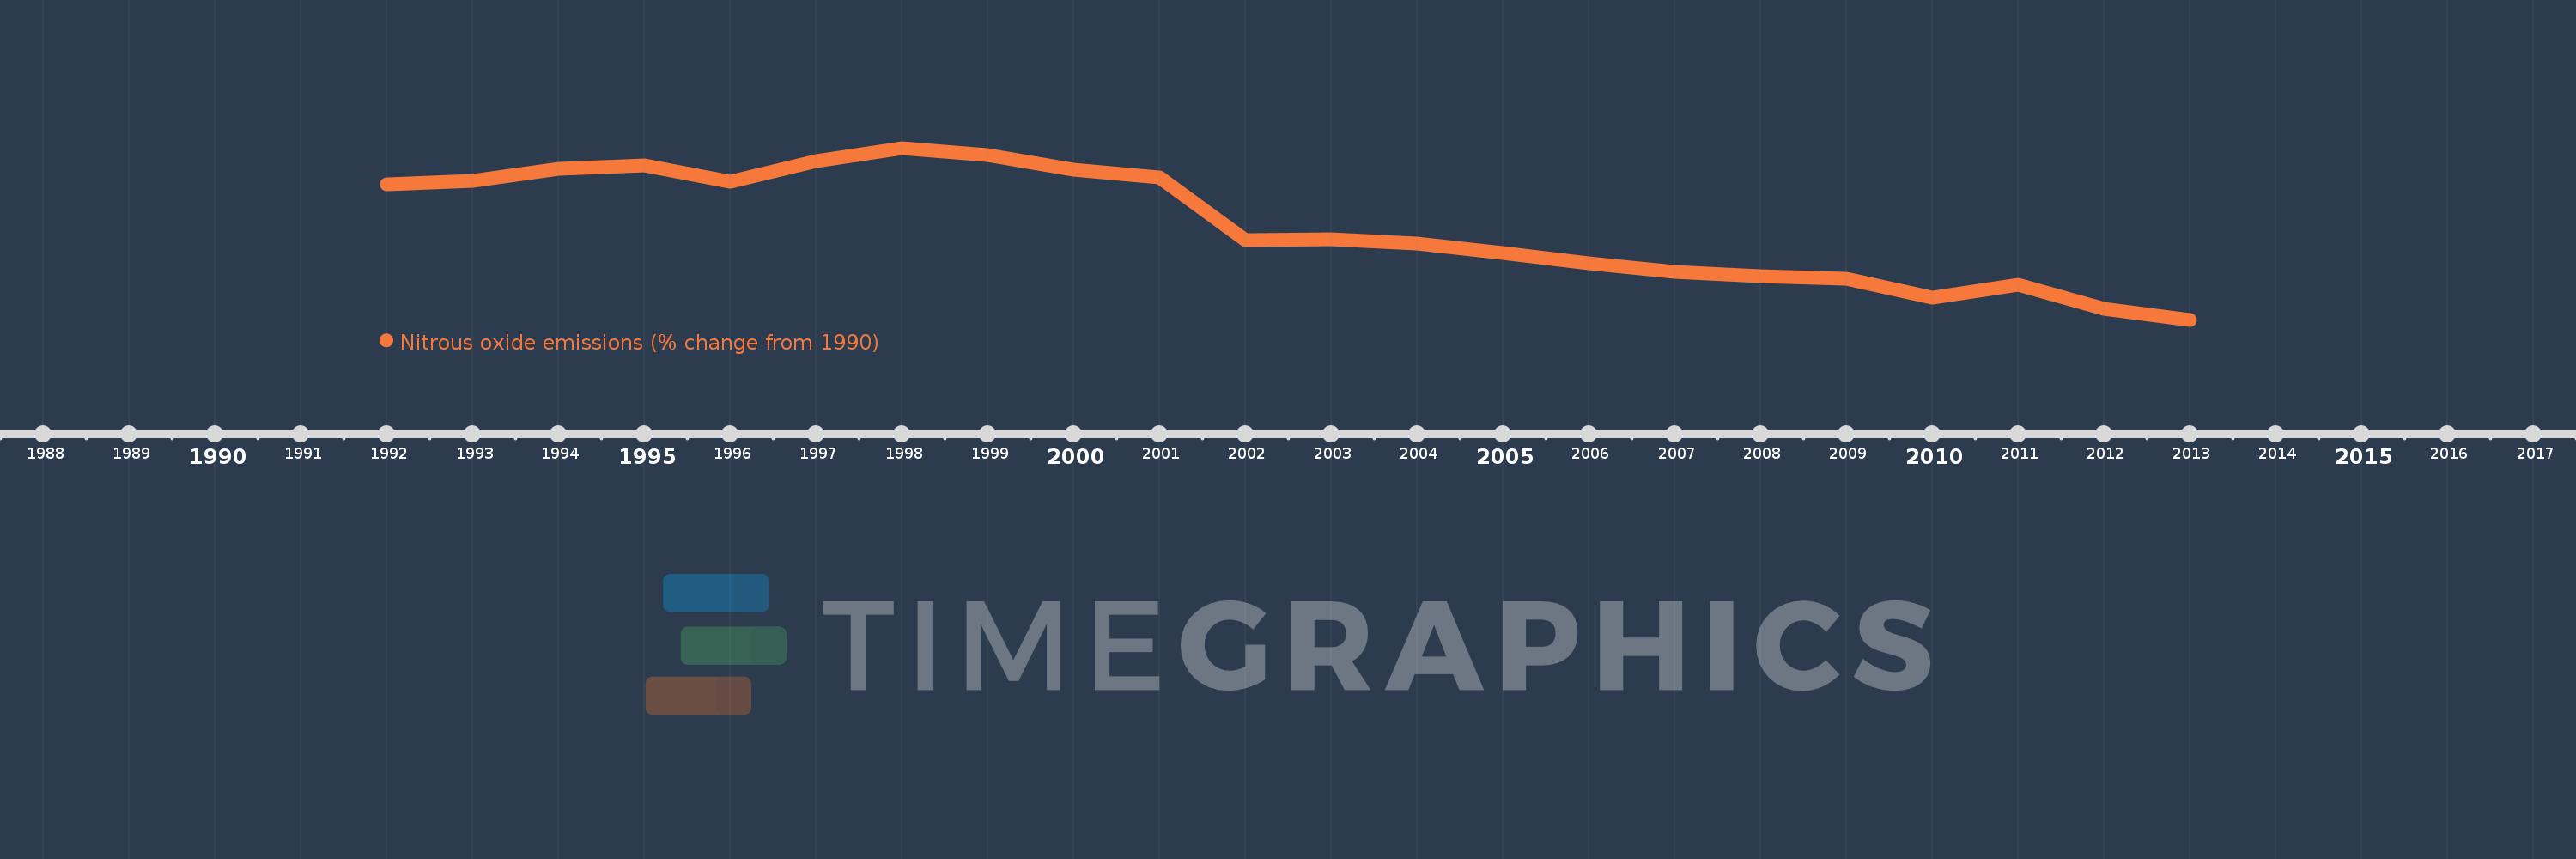
This timeline shows a graph from 1992 to 2013 of Sweden. No data until 1991. Number of actual observations by date: 22.
Source name:
World Development Indicators
Source organization:
World Bank staff estimates from original source: European Commission, Joint Research Centre (JRC)/Netherlands Environmental Assessment Agency (PBL). Emission Database for Global Atmospheric Research (EDGAR): http://edgar.jrc.ec.europa.eu/.
Categories, topics:
Climate Change, Environment
Last updated:
apr 23, 2017
Indicators value changes by year
Meaning:
-9.784
Minimum:
-25.427
jan 1, 2013
Maximum:
3.202
jan 1, 1998
At the date of observation
Value
Absolute change
Change from the previous value
jan 1, 1992
-2.911
-2.911
0.0%
jan 1, 1993
-2.351
+0.56
-19.25%
jan 1, 1994
-0.3
+2.051
-87.23%
jan 1, 1995
0.313
+0.613
-204.13%
jan 1, 1996
-2.405
-2.717
-869.41%
jan 1, 1997
1.003
+3.408
-141.7%
jan 1, 1998
3.202
+2.199
219.34%
jan 1, 1999
2.072
-1.13
-35.28%
jan 1, 2000
-0.355
-2.427
-117.11%
jan 1, 2001
-1.67
-1.316
371.04%
jan 1, 2002
-12.112
-10.442
625.1%
jan 1, 2003
-12.068
+0.044
-0.37%
jan 1, 2004
-12.716
-0.648
5.37%
jan 1, 2005
-14.285
-1.569
12.34%
jan 1, 2006
-16.076
-1.791
12.54%
jan 1, 2007
-17.425
-1.349
8.39%
jan 1, 2008
-18.209
-0.784
4.5%
jan 1, 2009
-18.551
-0.342
1.88%
jan 1, 2010
-21.73
-3.179
17.14%
jan 1, 2011
-19.665
+2.065
-9.5%
jan 1, 2012
-23.579
-3.914
19.9%
jan 1, 2013
-25.427
-1.849
7.84%
Ranking of countries by current statistics by years