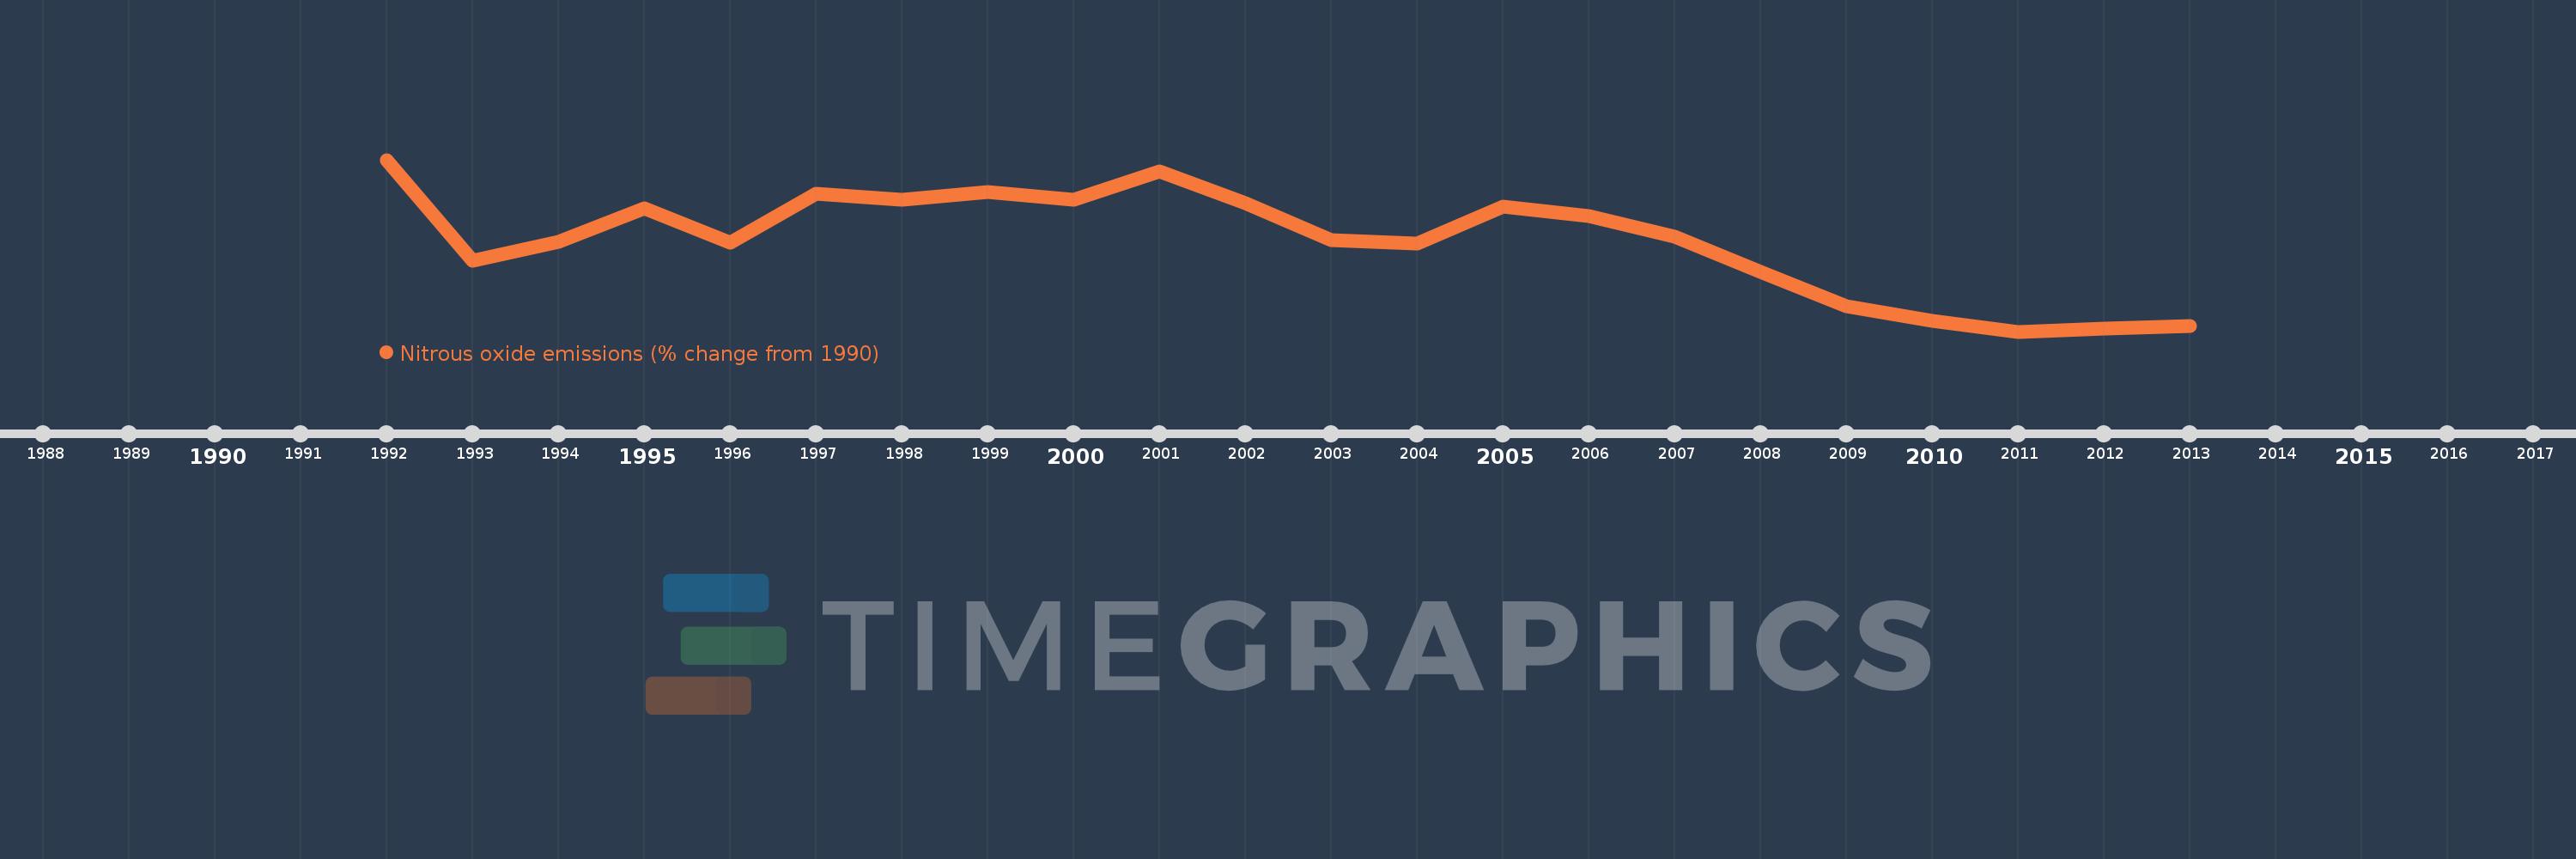
This timeline shows a graph from 1992 to 2013 of Hungary. No data until 1991. Number of actual observations by date: 22.
Source name:
World Development Indicators
Source organization:
World Bank staff estimates from original source: European Commission, Joint Research Centre (JRC)/Netherlands Environmental Assessment Agency (PBL). Emission Database for Global Atmospheric Research (EDGAR): http://edgar.jrc.ec.europa.eu/.
Categories, topics:
Climate Change, Environment
Last updated:
apr 23, 2017
Indicators value changes by year
Meaning:
-41.137
Minimum:
-61.041
jan 1, 2011
Maximum:
-23.352
jan 1, 1992
At the date of observation
Value
Absolute change
Change from the previous value
jan 1, 1992
-23.352
-23.352
0.0%
jan 1, 1993
-45.434
-22.082
94.56%
jan 1, 1994
-41.415
+4.018
-8.84%
jan 1, 1995
-33.925
+7.49
-18.08%
jan 1, 1996
-41.53
-7.604
22.41%
jan 1, 1997
-30.745
+10.785
-25.97%
jan 1, 1998
-32.121
-1.376
4.48%
jan 1, 1999
-30.345
+1.776
-5.53%
jan 1, 2000
-32.031
-1.685
5.55%
jan 1, 2001
-25.925
+6.106
-19.06%
jan 1, 2002
-32.79
-6.866
26.48%
jan 1, 2003
-40.903
-8.113
24.74%
jan 1, 2004
-41.653
-0.75
1.83%
jan 1, 2005
-33.66
+7.993
-19.19%
jan 1, 2006
-35.67
-2.01
5.97%
jan 1, 2007
-40.176
-4.505
12.63%
jan 1, 2008
-47.965
-7.789
19.39%
jan 1, 2009
-55.422
-7.457
15.55%
jan 1, 2010
-58.773
-3.351
6.05%
jan 1, 2011
-61.041
-2.268
3.86%
jan 1, 2012
-60.392
+0.648
-1.06%
jan 1, 2013
-59.744
+0.648
-1.07%
Ranking of countries by current statistics by years