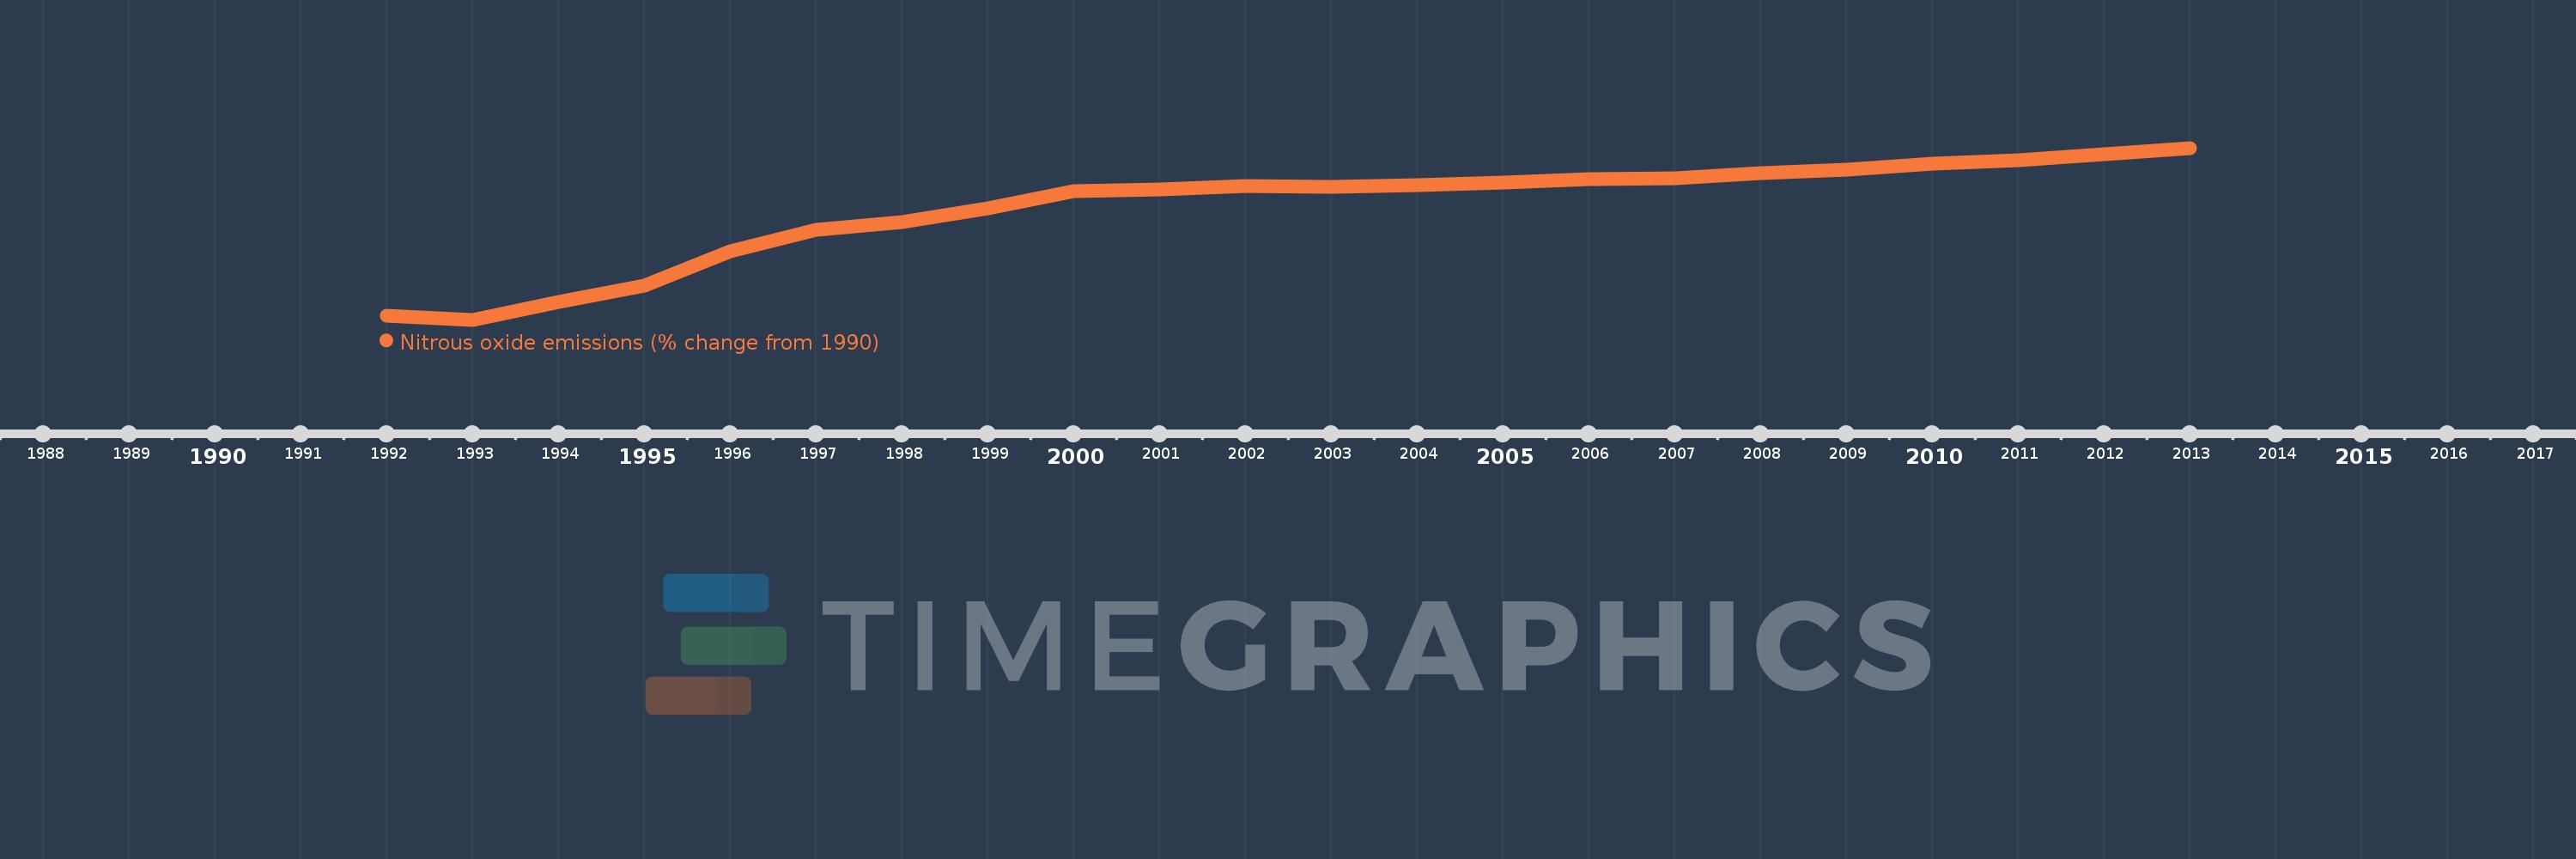
This timeline shows a graph from 1992 to 2013 of Djibouti. No data until 1991. Number of actual observations by date: 22.
Source name:
World Development Indicators
Source organization:
World Bank staff estimates from original source: European Commission, Joint Research Centre (JRC)/Netherlands Environmental Assessment Agency (PBL). Emission Database for Global Atmospheric Research (EDGAR): http://edgar.jrc.ec.europa.eu/.
Categories, topics:
Climate Change, Environment
Last updated:
apr 23, 2017
Indicators value changes by year
Meaning:
24.26
Minimum:
-0.158
jan 1, 1993
Maximum:
37.442
jan 1, 2013
At the date of observation
Value
Absolute change
Change from the previous value
jan 1, 1992
0.653
+0.653
0.0%
jan 1, 1993
-0.158
-0.811
-124.26%
jan 1, 1994
3.661
+3.819
-2.41K%
jan 1, 1995
7.399
+3.738
102.09%
jan 1, 1996
14.806
+7.407
100.11%
jan 1, 1997
19.523
+4.717
31.86%
jan 1, 1998
21.175
+1.652
8.46%
jan 1, 1999
24.303
+3.128
14.77%
jan 1, 2000
28.072
+3.768
15.51%
jan 1, 2001
28.348
+0.276
0.98%
jan 1, 2002
29.206
+0.858
3.03%
jan 1, 2003
28.973
-0.233
-0.8%
jan 1, 2004
29.345
+0.372
1.28%
jan 1, 2005
29.951
+0.607
2.07%
jan 1, 2006
30.646
+0.695
2.32%
jan 1, 2007
30.834
+0.187
0.61%
jan 1, 2008
31.989
+1.155
3.75%
jan 1, 2009
32.735
+0.746
2.33%
jan 1, 2010
33.982
+1.247
3.81%
jan 1, 2011
34.747
+0.765
2.25%
jan 1, 2012
36.095
+1.347
3.88%
jan 1, 2013
37.442
+1.347
3.73%
Ranking of countries by current statistics by years