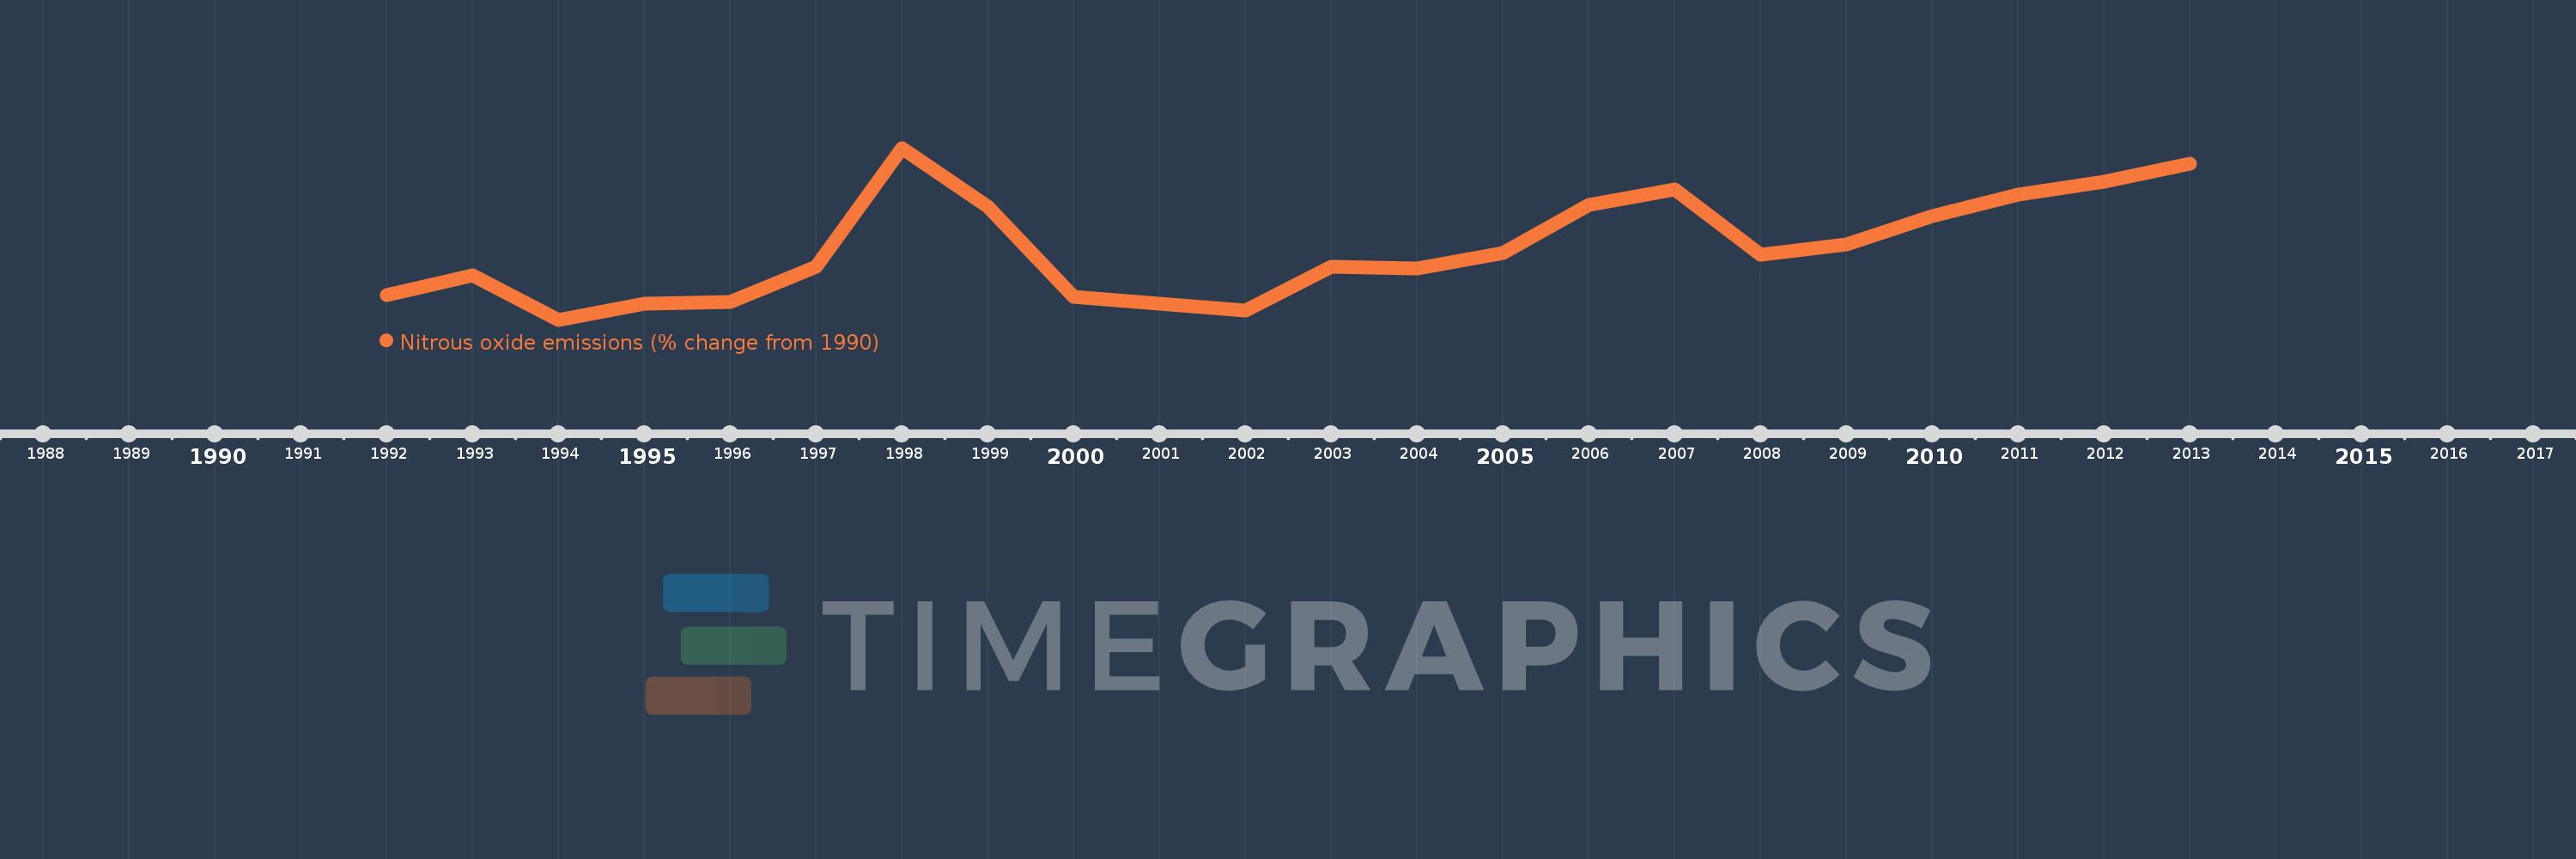
This timeline shows a graph from 1992 to 2013 of IBRD only. No data until 1991. Number of actual observations by date: 22.
Source name:
World Development Indicators
Source organization:
World Bank staff estimates from original source: European Commission, Joint Research Centre (JRC)/Netherlands Environmental Assessment Agency (PBL). Emission Database for Global Atmospheric Research (EDGAR): http://edgar.jrc.ec.europa.eu/.
Categories, topics:
Climate Change, Environment
Last updated:
apr 23, 2017
Indicators value changes by year
Meaning:
7.439
Minimum:
-1.059
jan 1, 1994
Maximum:
19.402
jan 1, 1998
At the date of observation
Value
Absolute change
Change from the previous value
jan 1, 1992
1.873
+1.873
0.0%
jan 1, 1993
4.266
+2.393
127.76%
jan 1, 1994
-1.059
-5.326
-124.83%
jan 1, 1995
0.894
+1.953
-184.36%
jan 1, 1996
1.061
+0.168
18.77%
jan 1, 1997
5.236
+4.175
393.38%
jan 1, 1998
19.402
+14.166
270.54%
jan 1, 1999
12.445
-6.957
-35.86%
jan 1, 2000
1.654
-10.791
-86.71%
jan 1, 2001
0.877
-0.777
-46.98%
jan 1, 2002
0.028
-0.849
-96.77%
jan 1, 2003
5.208
+5.18
18.29K%
jan 1, 2004
5.09
-0.118
-2.26%
jan 1, 2005
6.93
+1.839
36.13%
jan 1, 2006
12.572
+5.642
81.42%
jan 1, 2007
14.49
+1.919
15.26%
jan 1, 2008
6.667
-7.823
-53.99%
jan 1, 2009
7.891
+1.224
18.36%
jan 1, 2010
11.289
+3.397
43.05%
jan 1, 2011
13.838
+2.549
22.58%
jan 1, 2012
15.432
+1.594
11.52%
jan 1, 2013
17.562
+2.13
13.8%
Ranking of countries by current statistics by years