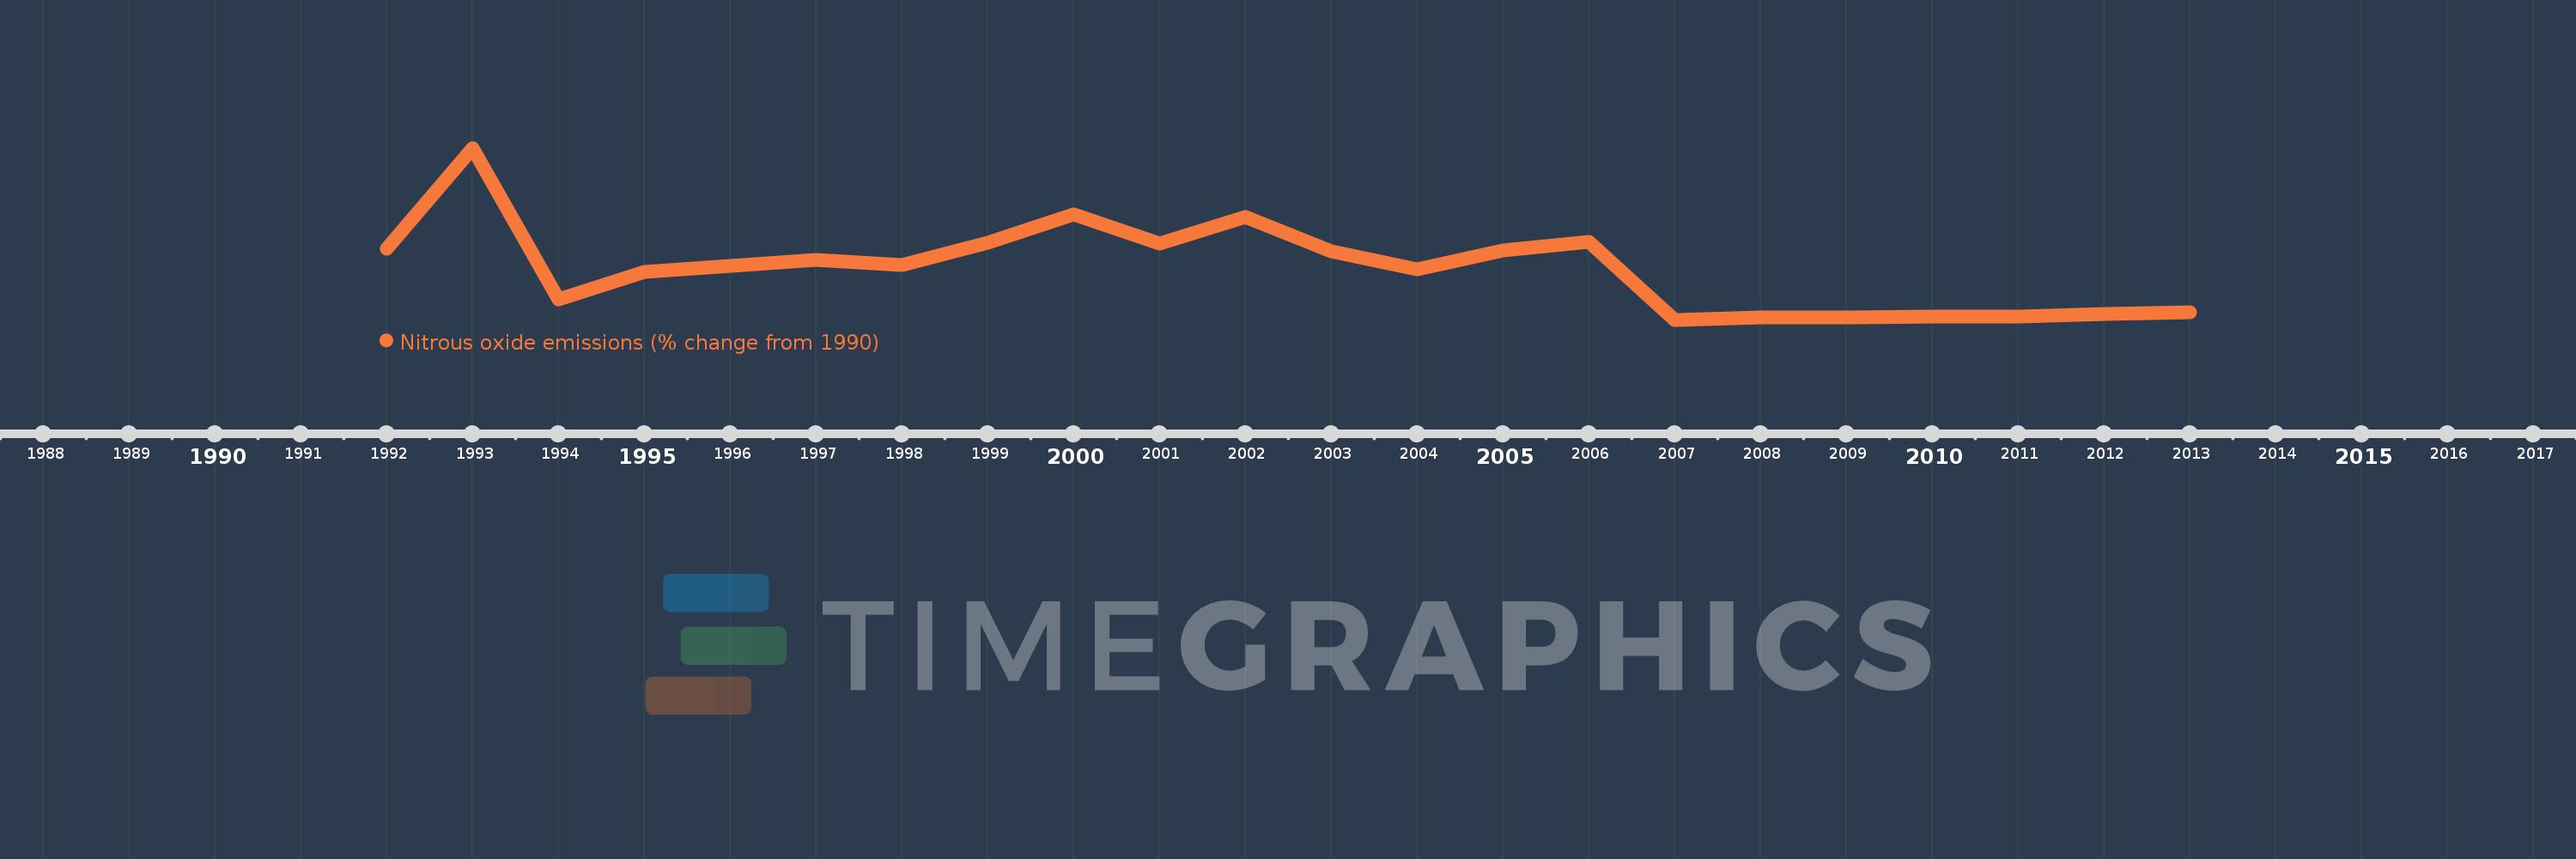
This timeline shows a graph from 1992 to 2013 of Zimbabwe. No data until 1991. Number of actual observations by date: 22.
Source name:
World Development Indicators
Source organization:
World Bank staff estimates from original source: European Commission, Joint Research Centre (JRC)/Netherlands Environmental Assessment Agency (PBL). Emission Database for Global Atmospheric Research (EDGAR): http://edgar.jrc.ec.europa.eu/.
Categories, topics:
Climate Change, Environment
Last updated:
apr 23, 2017
Indicators value changes by year
Meaning:
-24.859
Minimum:
-40.348
jan 1, 2007
Maximum:
11.471
jan 1, 1993
At the date of observation
Value
Absolute change
Change from the previous value
jan 1, 1992
-19.019
-19.019
0.0%
jan 1, 1993
11.471
+30.489
-160.31%
jan 1, 1994
-34.31
-45.781
-399.12%
jan 1, 1995
-25.928
+8.382
-24.43%
jan 1, 1996
-24.213
+1.715
-6.62%
jan 1, 1997
-22.183
+2.03
-8.38%
jan 1, 1998
-23.831
-1.648
7.43%
jan 1, 1999
-17.071
+6.76
-28.37%
jan 1, 2000
-8.576
+8.495
-49.76%
jan 1, 2001
-17.345
-8.769
102.25%
jan 1, 2002
-9.449
+7.896
-45.52%
jan 1, 2003
-19.707
-10.258
108.57%
jan 1, 2004
-25.258
-5.551
28.17%
jan 1, 2005
-19.483
+5.775
-22.87%
jan 1, 2006
-16.811
+2.671
-13.71%
jan 1, 2007
-40.348
-23.536
140.0%
jan 1, 2008
-39.699
+0.649
-1.61%
jan 1, 2009
-39.64
+0.059
-0.15%
jan 1, 2010
-39.276
+0.364
-0.92%
jan 1, 2011
-39.348
-0.071
0.18%
jan 1, 2012
-38.741
+0.607
-1.54%
jan 1, 2013
-38.134
+0.607
-1.57%
Ranking of countries by current statistics by years