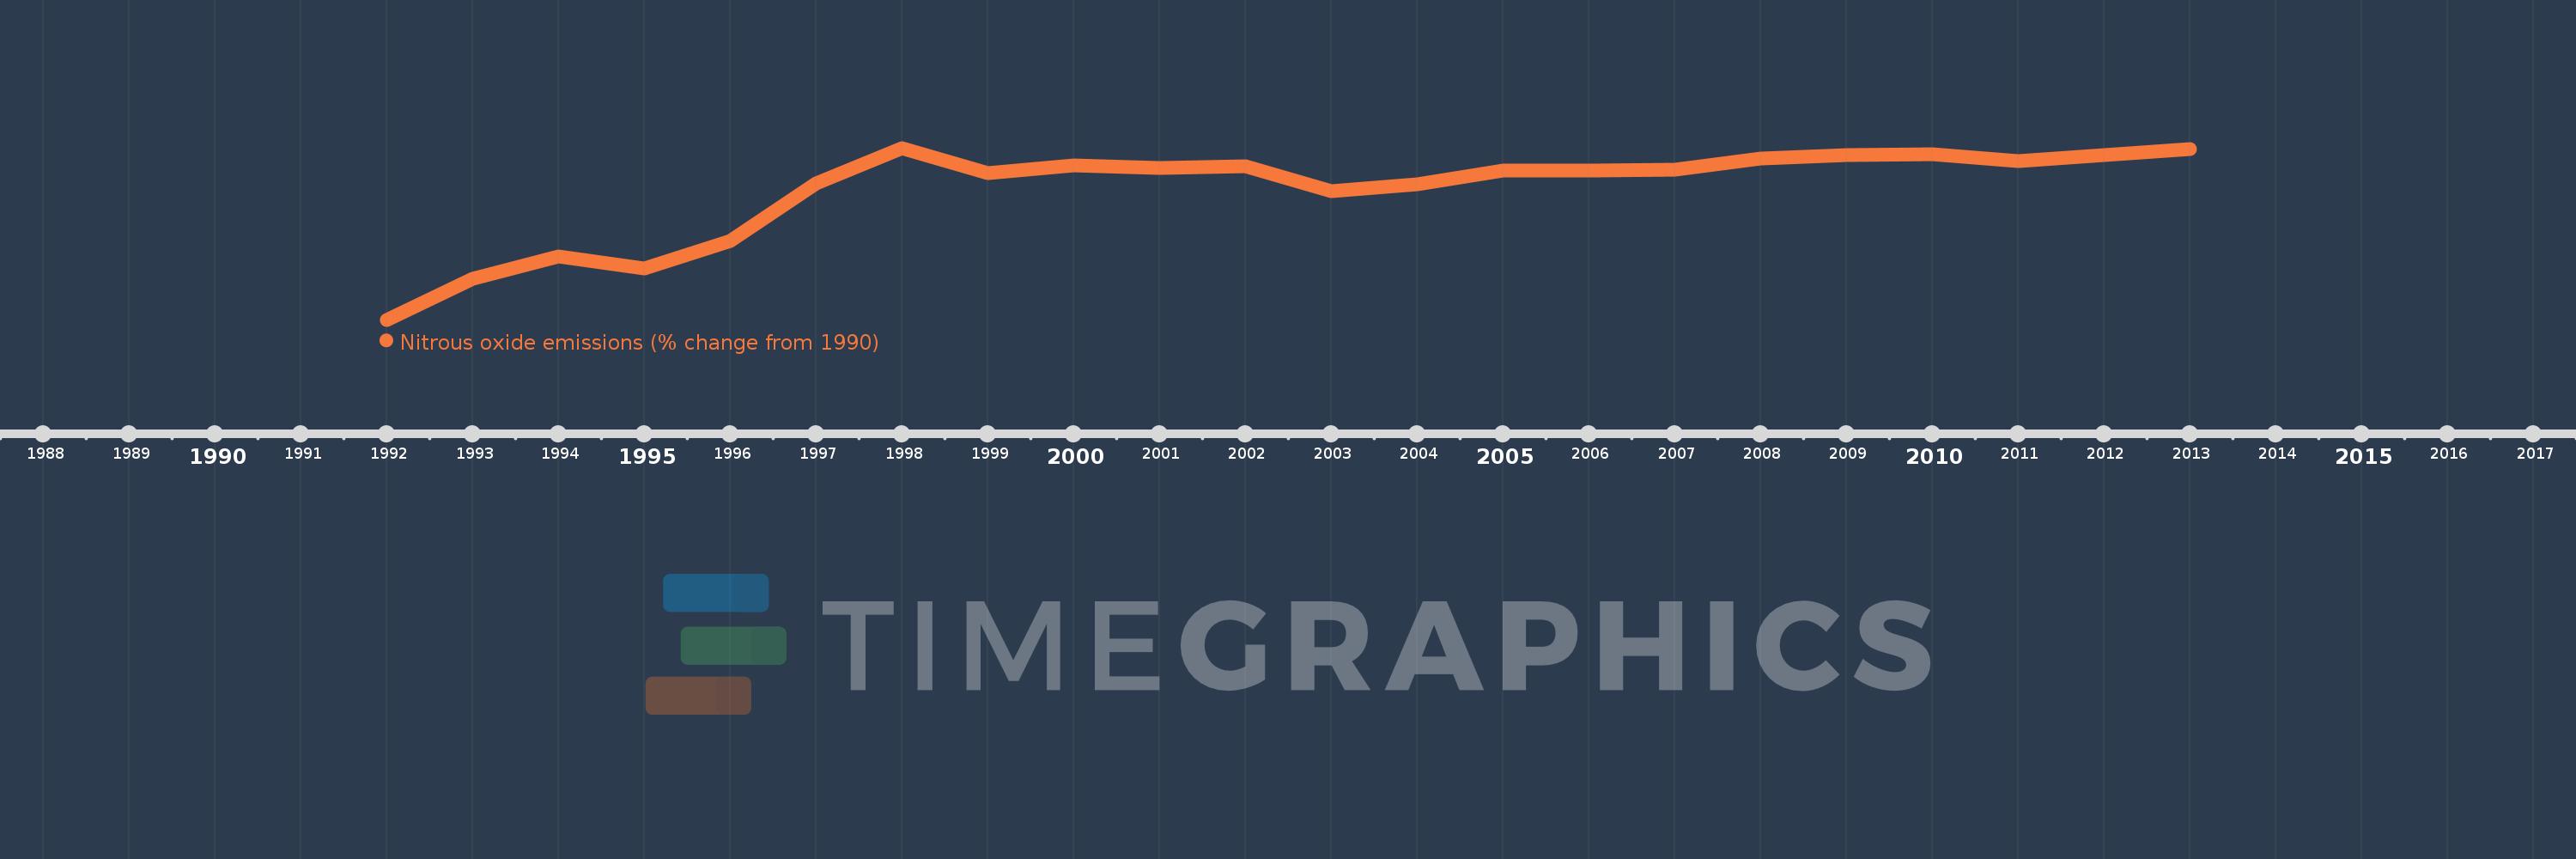
This timeline shows a graph from 1992 to 2013 of Philippines. No data until 1991. Number of actual observations by date: 22.
Source name:
World Development Indicators
Source organization:
World Bank staff estimates from original source: European Commission, Joint Research Centre (JRC)/Netherlands Environmental Assessment Agency (PBL). Emission Database for Global Atmospheric Research (EDGAR): http://edgar.jrc.ec.europa.eu/.
Categories, topics:
Climate Change, Environment
Last updated:
apr 23, 2017
Indicators value changes by year
Meaning:
20.473
Minimum:
-6.776
jan 1, 1992
Maximum:
29.403
jan 1, 1998
At the date of observation
Value
Absolute change
Change from the previous value
jan 1, 1992
-6.776
-6.776
0.0%
jan 1, 1993
1.781
+8.557
-126.29%
jan 1, 1994
6.622
+4.84
271.7%
jan 1, 1995
4.098
-2.524
-38.12%
jan 1, 1996
9.817
+5.72
139.58%
jan 1, 1997
21.997
+12.179
124.06%
jan 1, 1998
29.403
+7.407
33.67%
jan 1, 1999
24.041
-5.362
-18.24%
jan 1, 2000
25.662
+1.621
6.74%
jan 1, 2001
25.122
-0.541
-2.11%
jan 1, 2002
25.476
+0.355
1.41%
jan 1, 2003
20.263
-5.213
-20.46%
jan 1, 2004
21.823
+1.559
7.7%
jan 1, 2005
24.644
+2.821
12.93%
jan 1, 2006
24.701
+0.057
0.23%
jan 1, 2007
24.895
+0.194
0.78%
jan 1, 2008
27.162
+2.267
9.11%
jan 1, 2009
27.899
+0.737
2.71%
jan 1, 2010
28.164
+0.265
0.95%
jan 1, 2011
26.607
-1.557
-5.53%
jan 1, 2012
27.873
+1.266
4.76%
jan 1, 2013
29.139
+1.266
4.54%
Ranking of countries by current statistics by years