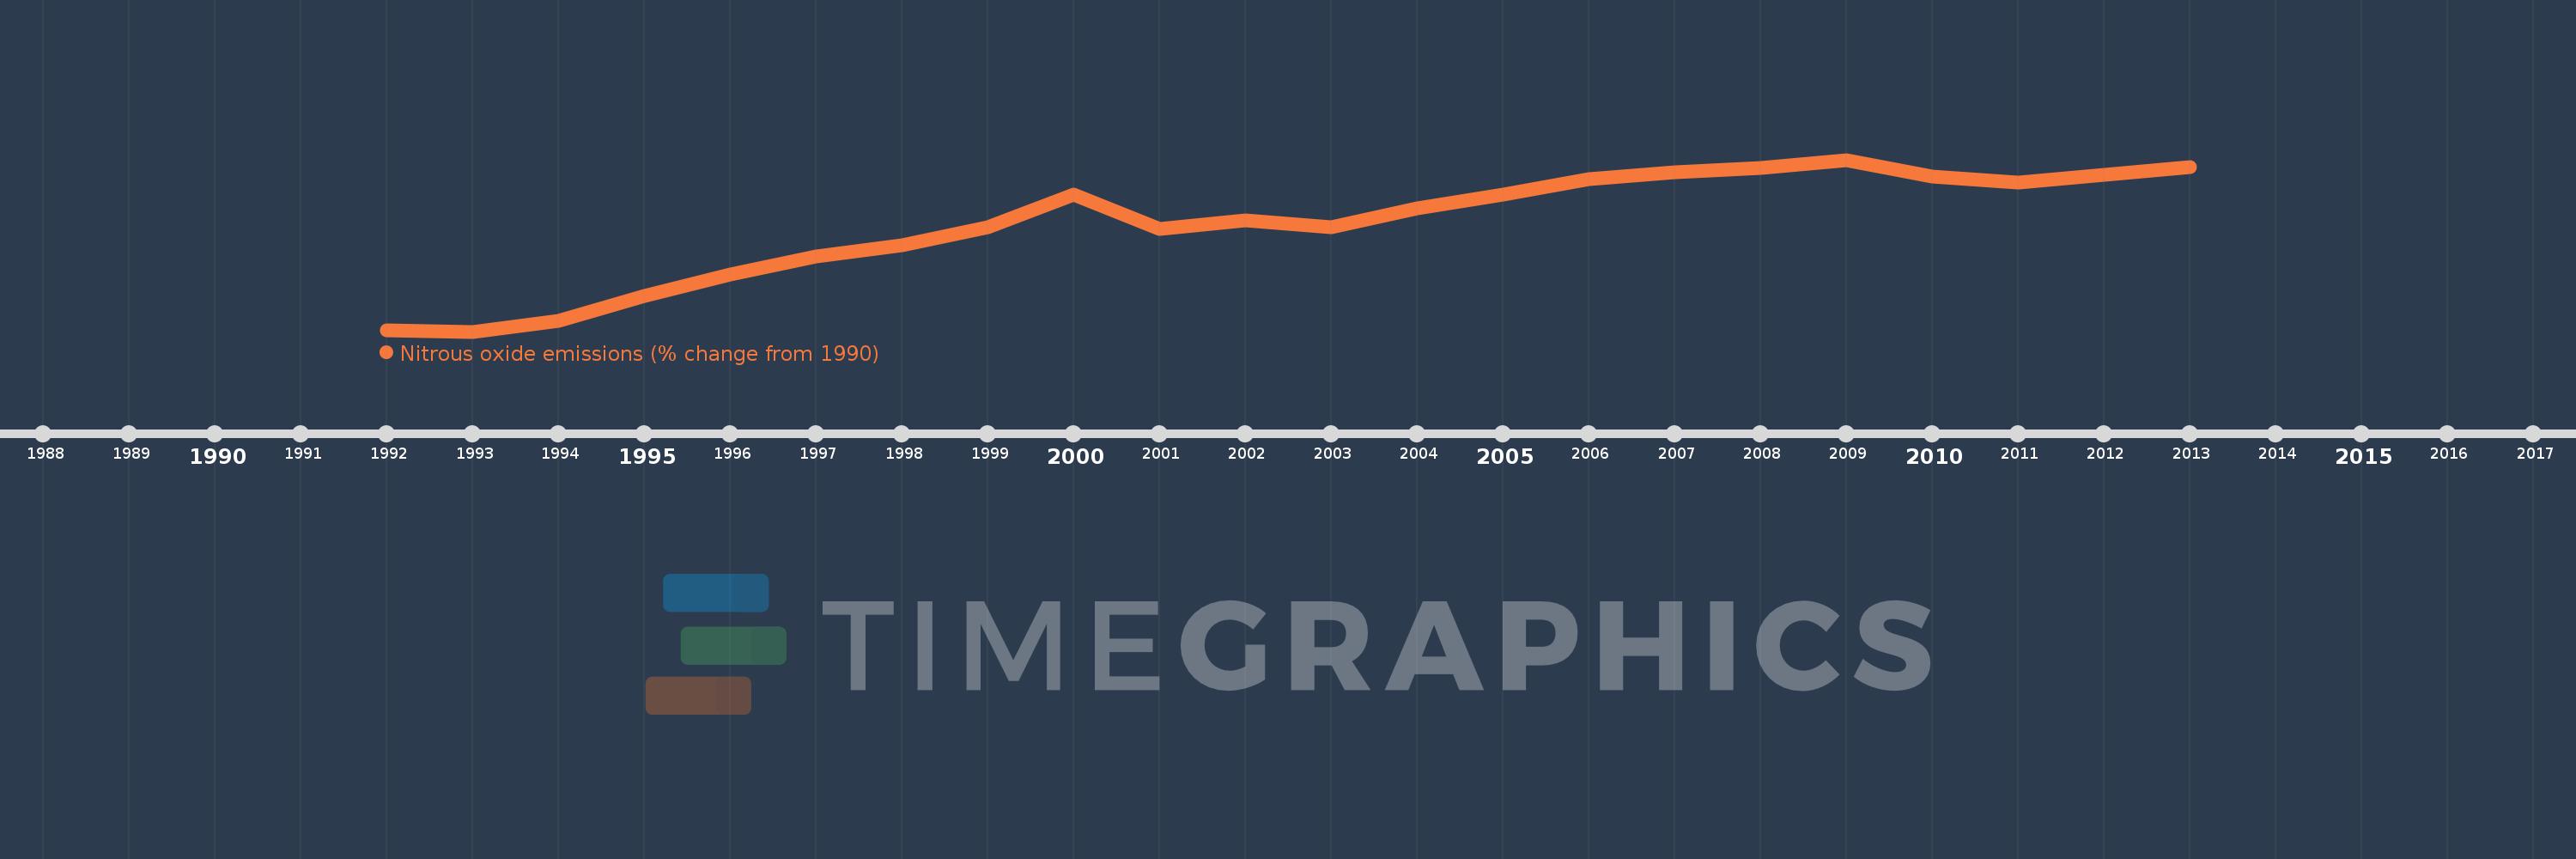
This timeline shows a graph from 1992 to 2013 of Nepal. No data until 1991. Number of actual observations by date: 22.
Source name:
World Development Indicators
Source organization:
World Bank staff estimates from original source: European Commission, Joint Research Centre (JRC)/Netherlands Environmental Assessment Agency (PBL). Emission Database for Global Atmospheric Research (EDGAR): http://edgar.jrc.ec.europa.eu/.
Categories, topics:
Climate Change, Environment
Last updated:
apr 23, 2017
Indicators value changes by year
Meaning:
18.549
Minimum:
0.731
jan 1, 1993
Maximum:
29.298
jan 1, 2009
At the date of observation
Value
Absolute change
Change from the previous value
jan 1, 1992
0.885
+0.885
0.0%
jan 1, 1993
0.731
-0.154
-17.37%
jan 1, 1994
2.451
+1.72
235.3%
jan 1, 1995
6.613
+4.161
169.75%
jan 1, 1996
10.193
+3.58
54.13%
jan 1, 1997
13.274
+3.082
30.23%
jan 1, 1998
15.146
+1.872
14.1%
jan 1, 1999
18.14
+2.994
19.76%
jan 1, 2000
23.548
+5.408
29.81%
jan 1, 2001
17.832
-5.716
-24.27%
jan 1, 2002
19.17
+1.338
7.5%
jan 1, 2003
18.135
-1.035
-5.4%
jan 1, 2004
21.164
+3.029
16.7%
jan 1, 2005
23.568
+2.404
11.36%
jan 1, 2006
26.021
+2.453
10.41%
jan 1, 2007
27.159
+1.139
4.38%
jan 1, 2008
27.929
+0.769
2.83%
jan 1, 2009
29.298
+1.37
4.9%
jan 1, 2010
26.465
-2.834
-9.67%
jan 1, 2011
25.527
-0.937
-3.54%
jan 1, 2012
26.782
+1.255
4.92%
jan 1, 2013
28.038
+1.255
4.69%
Ranking of countries by current statistics by years