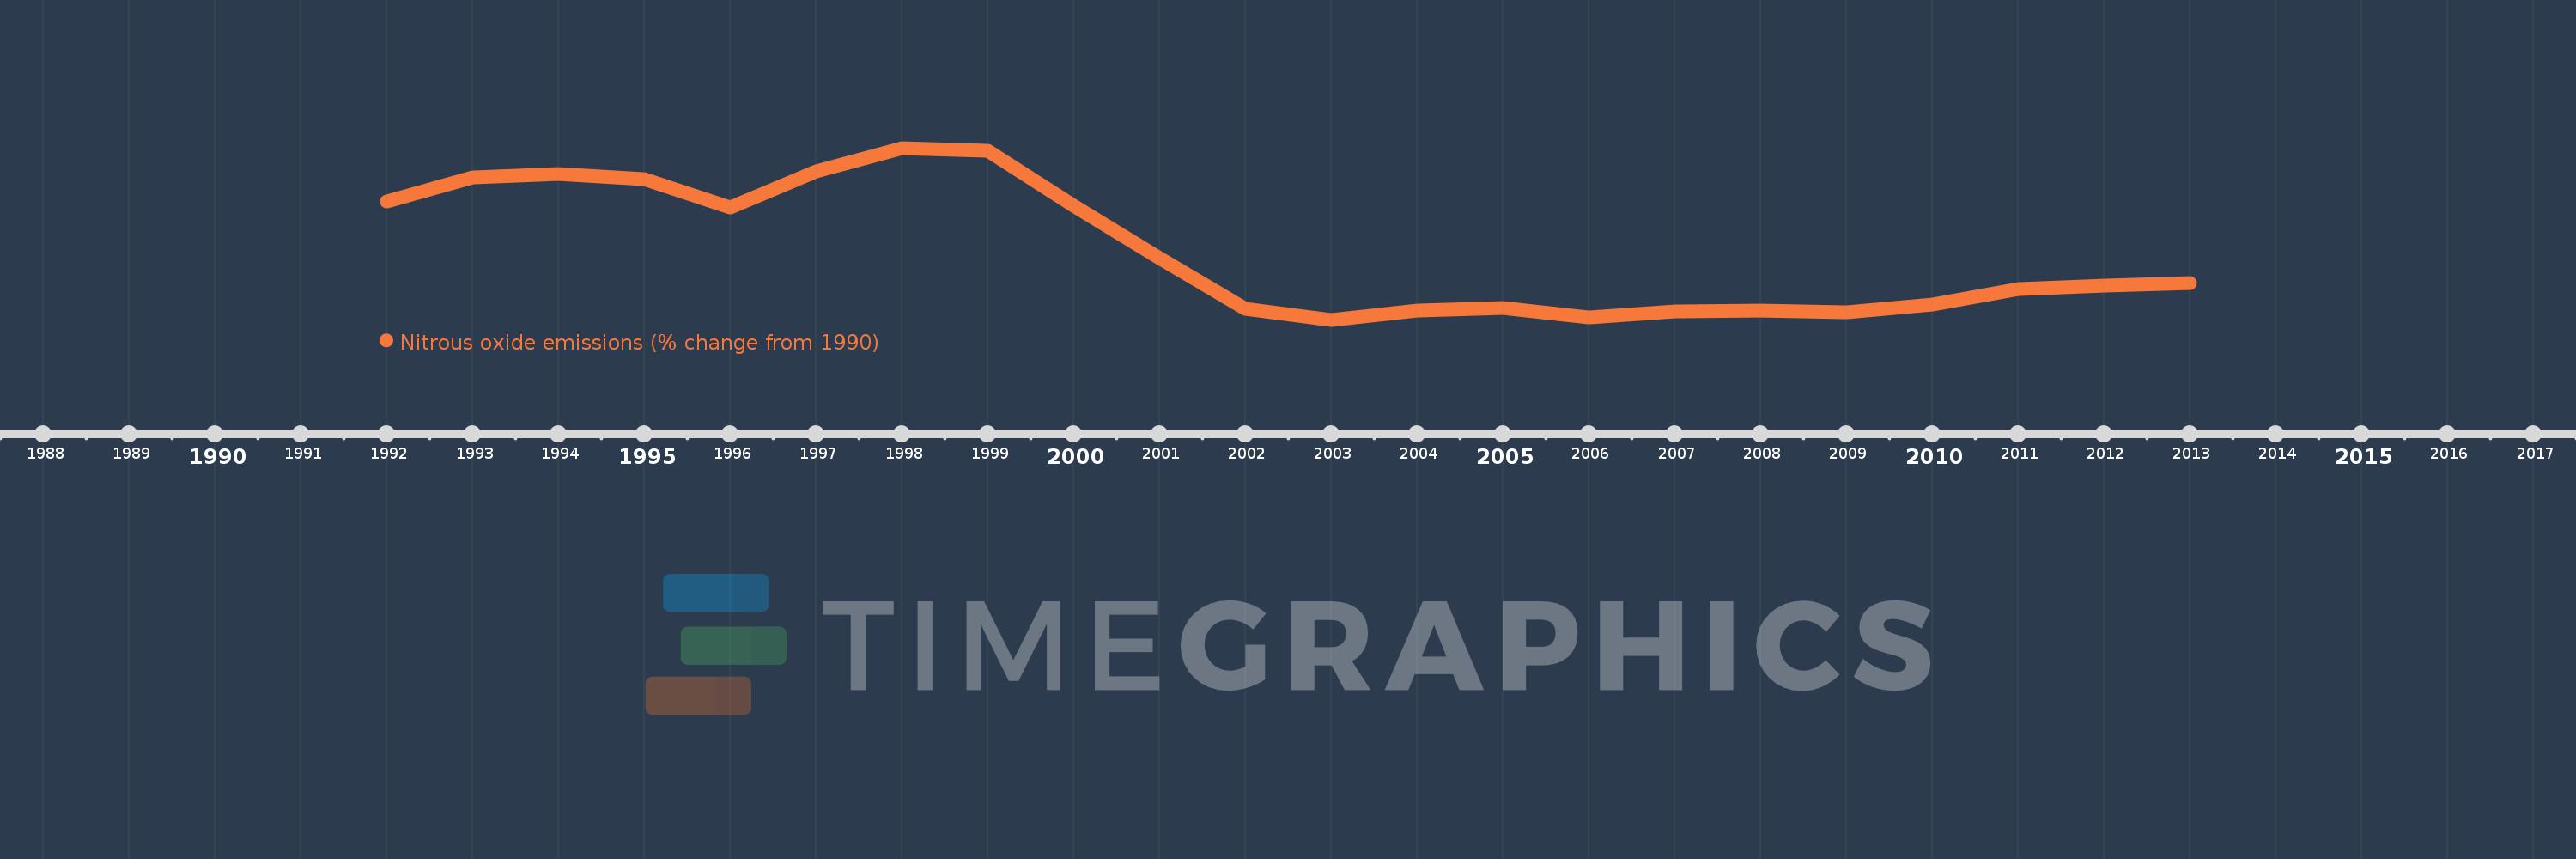
This timeline shows a graph from 1992 to 2013 of Costa Rica. No data until 1991. Number of actual observations by date: 22.
Source name:
World Development Indicators
Source organization:
World Bank staff estimates from original source: European Commission, Joint Research Centre (JRC)/Netherlands Environmental Assessment Agency (PBL). Emission Database for Global Atmospheric Research (EDGAR): http://edgar.jrc.ec.europa.eu/.
Categories, topics:
Climate Change, Environment
Last updated:
apr 23, 2017
Indicators value changes by year
Meaning:
-7.755
Minimum:
-25.277
jan 1, 2003
Maximum:
18.919
jan 1, 1998
At the date of observation
Value
Absolute change
Change from the previous value
jan 1, 1992
5.207
+5.207
0.0%
jan 1, 1993
11.254
+6.046
116.11%
jan 1, 1994
12.116
+0.862
7.66%
jan 1, 1995
10.9
-1.216
-10.03%
jan 1, 1996
3.579
-7.321
-67.16%
jan 1, 1997
12.843
+9.264
258.82%
jan 1, 1998
18.919
+6.076
47.31%
jan 1, 1999
18.238
-0.681
-3.6%
jan 1, 2000
4.079
-14.159
-77.63%
jan 1, 2001
-9.452
-13.531
-331.71%
jan 1, 2002
-22.516
-13.065
138.23%
jan 1, 2003
-25.277
-2.761
12.26%
jan 1, 2004
-22.994
+2.284
-9.03%
jan 1, 2005
-22.291
+0.703
-3.06%
jan 1, 2006
-24.639
-2.348
10.53%
jan 1, 2007
-23.116
+1.523
-6.18%
jan 1, 2008
-22.854
+0.262
-1.13%
jan 1, 2009
-23.39
-0.536
2.35%
jan 1, 2010
-21.399
+1.992
-8.51%
jan 1, 2011
-17.429
+3.97
-18.55%
jan 1, 2012
-16.604
+0.826
-4.74%
jan 1, 2013
-15.778
+0.826
-4.97%
Ranking of countries by current statistics by years