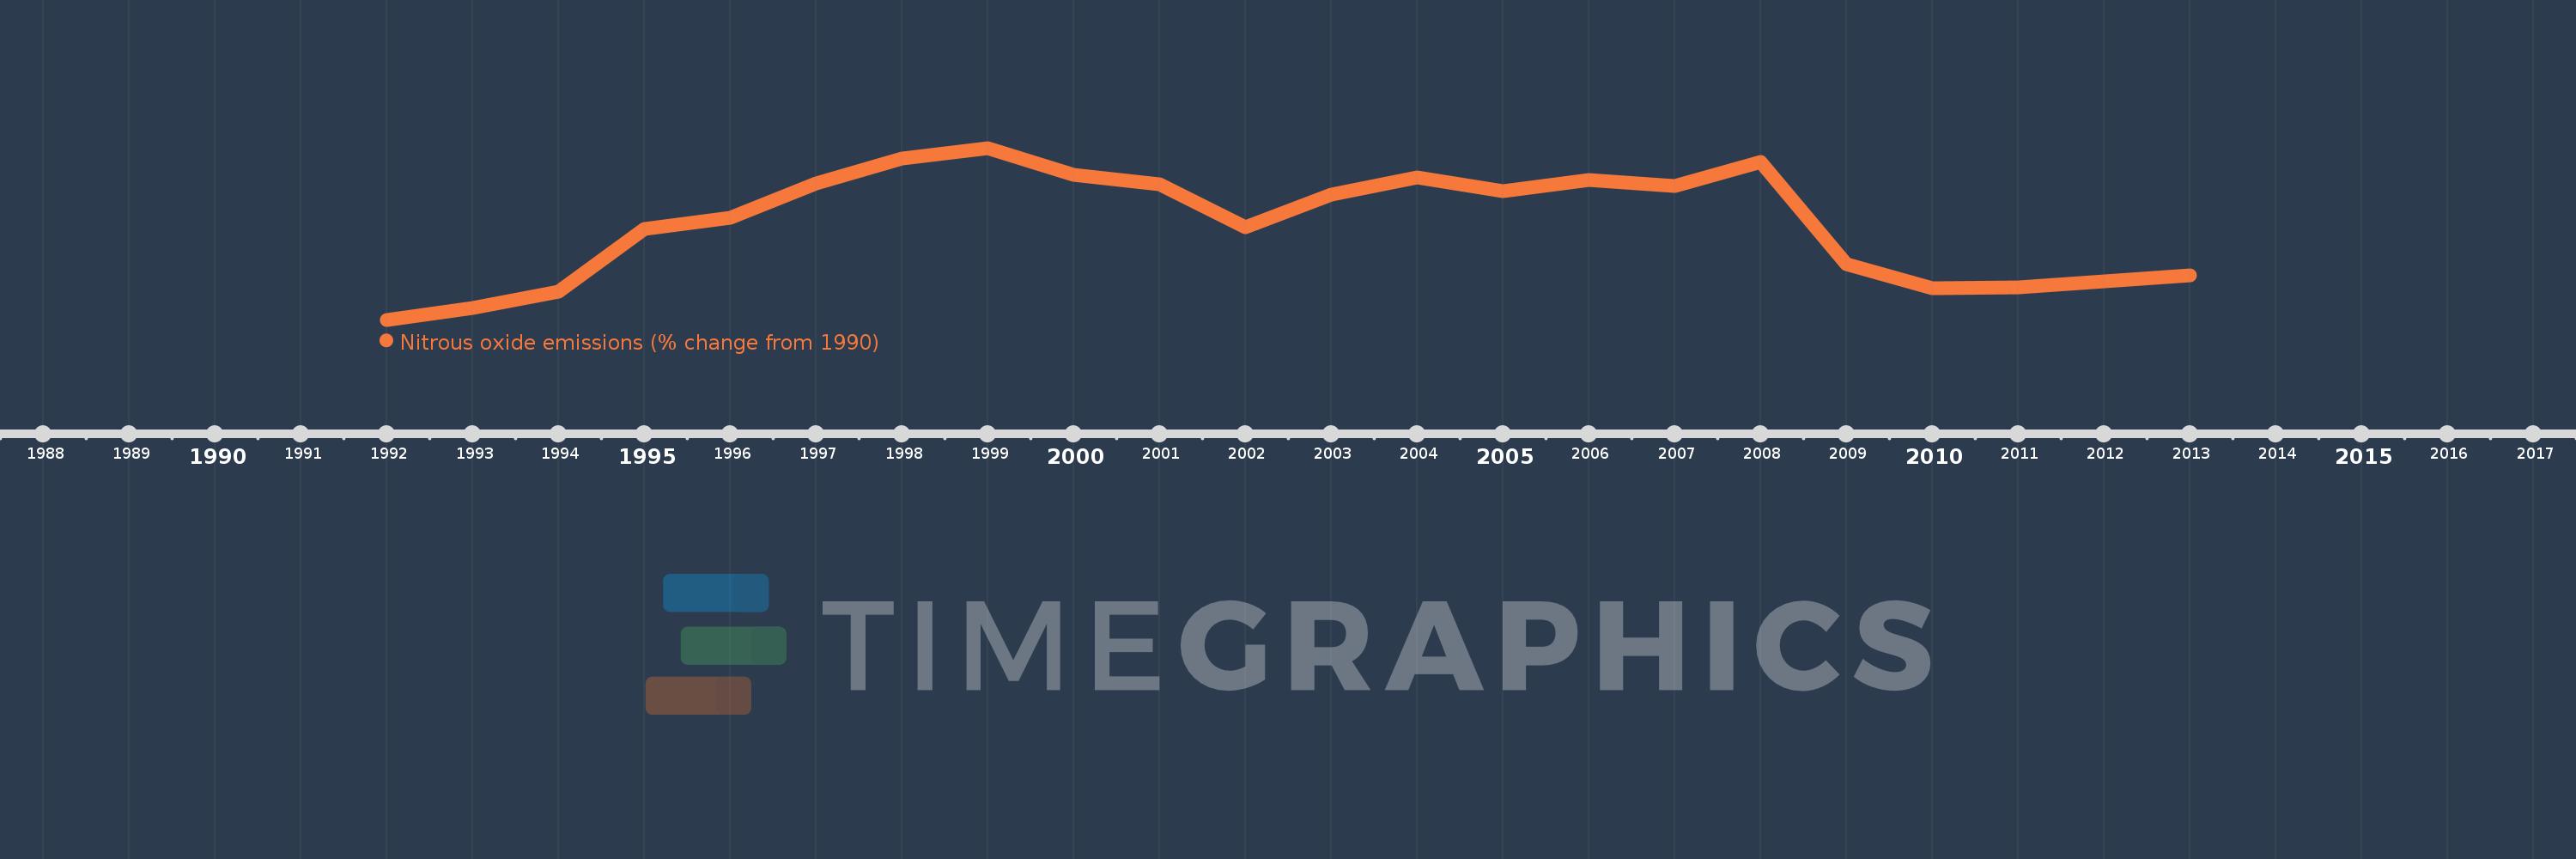
This timeline shows a graph from 1992 to 2013 of Israel. No data until 1991. Number of actual observations by date: 22.
Source name:
World Development Indicators
Source organization:
World Bank staff estimates from original source: European Commission, Joint Research Centre (JRC)/Netherlands Environmental Assessment Agency (PBL). Emission Database for Global Atmospheric Research (EDGAR): http://edgar.jrc.ec.europa.eu/.
Categories, topics:
Climate Change, Environment
Last updated:
apr 23, 2017
Indicators value changes by year
Meaning:
17.597
Minimum:
0.342
jan 1, 1992
Maximum:
31.329
jan 1, 1999
At the date of observation
Value
Absolute change
Change from the previous value
jan 1, 1992
0.342
+0.342
0.0%
jan 1, 1993
2.499
+2.157
630.58%
jan 1, 1994
5.433
+2.934
117.41%
jan 1, 1995
16.671
+11.238
206.87%
jan 1, 1996
18.689
+2.018
12.11%
jan 1, 1997
24.877
+6.188
33.11%
jan 1, 1998
29.48
+4.603
18.5%
jan 1, 1999
31.329
+1.849
6.27%
jan 1, 2000
26.437
-4.892
-15.61%
jan 1, 2001
24.717
-1.72
-6.51%
jan 1, 2002
17.09
-7.627
-30.86%
jan 1, 2003
22.841
+5.751
33.65%
jan 1, 2004
26.009
+3.168
13.87%
jan 1, 2005
23.578
-2.432
-9.35%
jan 1, 2006
25.51
+1.932
8.2%
jan 1, 2007
24.531
-0.978
-3.84%
jan 1, 2008
28.778
+4.246
17.31%
jan 1, 2009
10.395
-18.383
-63.88%
jan 1, 2010
5.971
-4.423
-42.55%
jan 1, 2011
6.254
+0.283
4.74%
jan 1, 2012
7.317
+1.063
16.99%
jan 1, 2013
8.379
+1.063
14.52%
Ranking of countries by current statistics by years