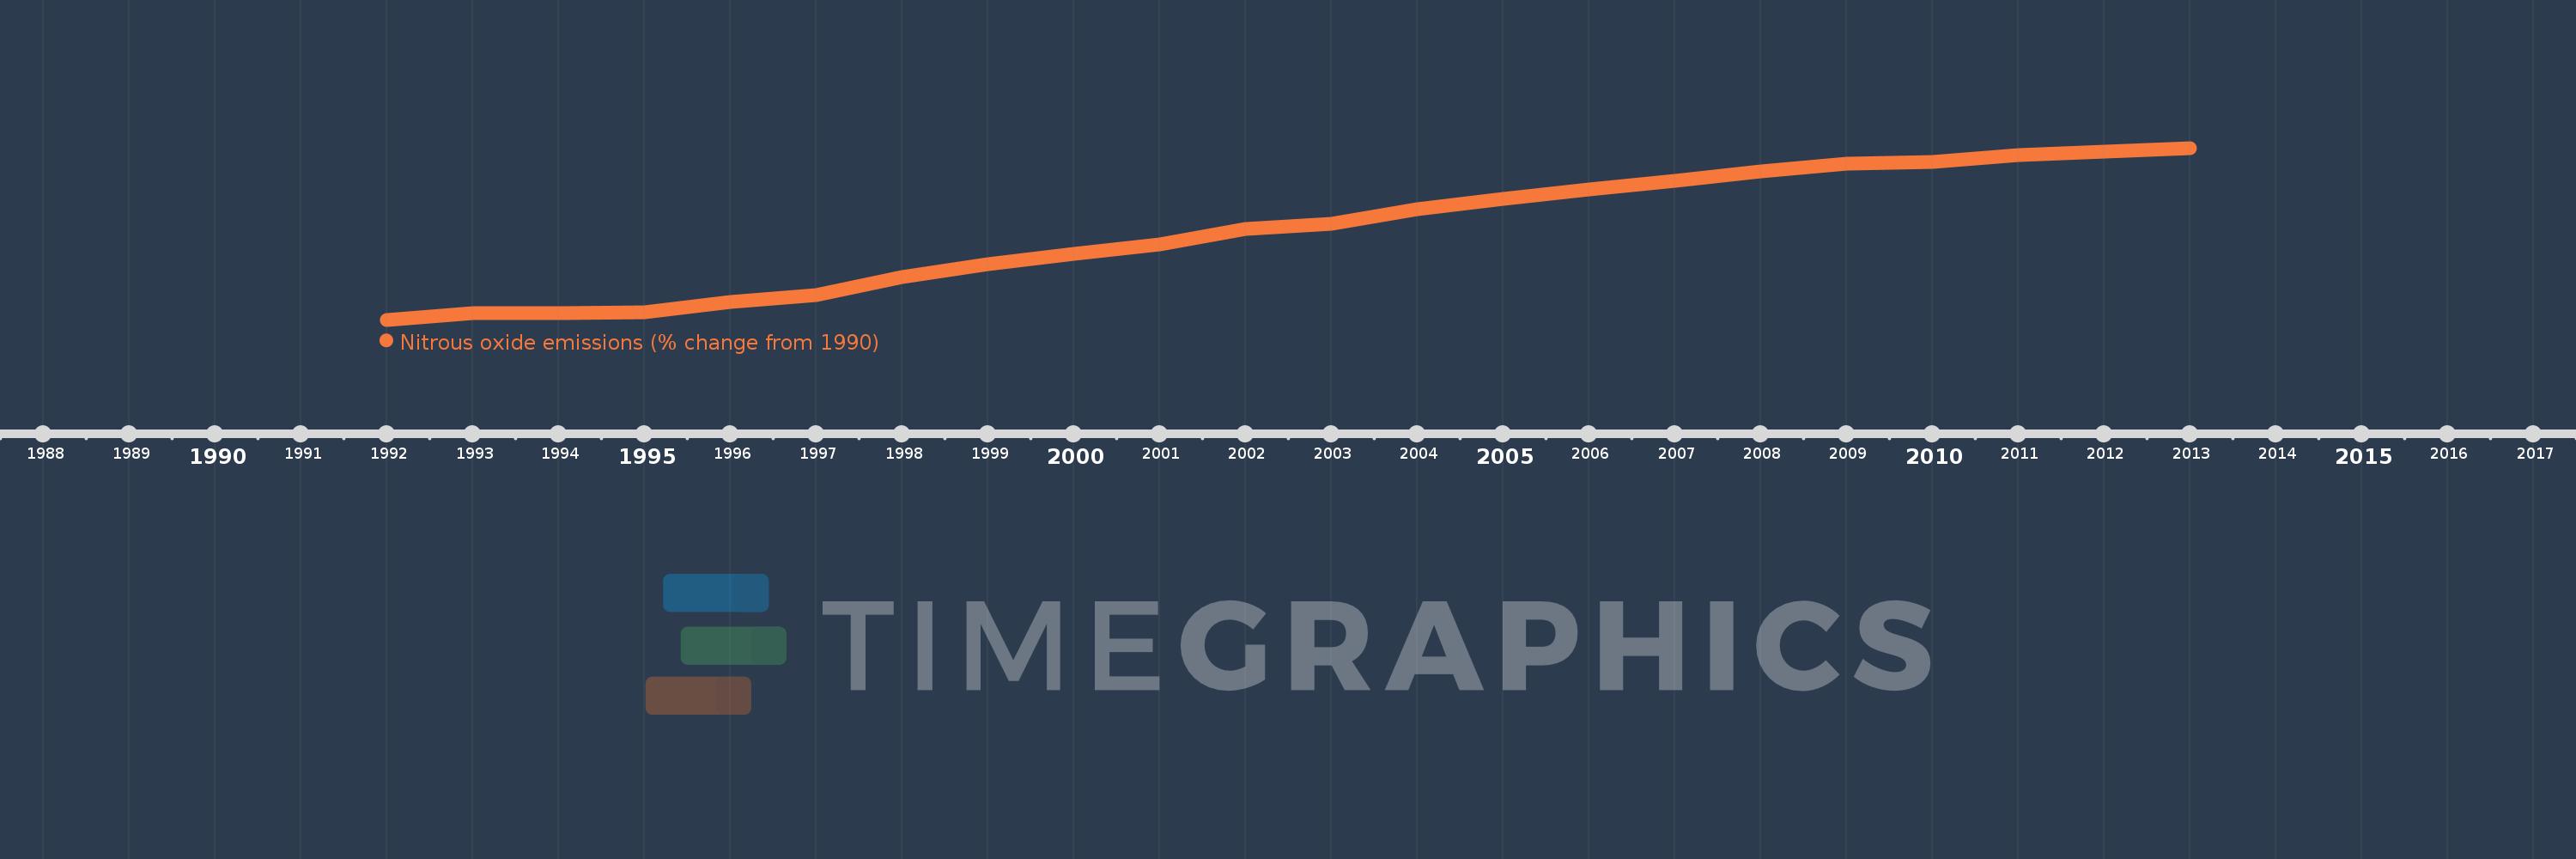
This timeline shows a graph from 1992 to 2013 of Yemen, Rep.. No data until 1991. Number of actual observations by date: 22.
Source name:
World Development Indicators
Source organization:
World Bank staff estimates from original source: European Commission, Joint Research Centre (JRC)/Netherlands Environmental Assessment Agency (PBL). Emission Database for Global Atmospheric Research (EDGAR): http://edgar.jrc.ec.europa.eu/.
Categories, topics:
Climate Change, Environment
Last updated:
apr 23, 2017
Indicators value changes by year
Meaning:
38.116
Minimum:
-4.013
jan 1, 1992
Maximum:
77.424
jan 1, 2013
At the date of observation
Value
Absolute change
Change from the previous value
jan 1, 1992
-4.013
-4.013
0.0%
jan 1, 1993
-0.947
+3.066
-76.4%
jan 1, 1994
-0.773
+0.174
-18.41%
jan 1, 1995
-0.382
+0.39
-50.52%
jan 1, 1996
4.235
+4.617
-1.21K%
jan 1, 1997
7.63
+3.395
80.17%
jan 1, 1998
16.209
+8.579
112.44%
jan 1, 1999
22.208
+6.0
37.01%
jan 1, 2000
27.055
+4.846
21.82%
jan 1, 2001
31.594
+4.54
16.78%
jan 1, 2002
38.889
+7.295
23.09%
jan 1, 2003
41.361
+2.471
6.35%
jan 1, 2004
48.431
+7.07
17.09%
jan 1, 2005
53.199
+4.768
9.85%
jan 1, 2006
57.649
+4.45
8.37%
jan 1, 2007
61.929
+4.279
7.42%
jan 1, 2008
66.451
+4.522
7.3%
jan 1, 2009
69.913
+3.462
5.21%
jan 1, 2010
70.861
+0.948
1.36%
jan 1, 2011
73.945
+3.084
4.35%
jan 1, 2012
75.684
+1.739
2.35%
jan 1, 2013
77.424
+1.739
2.3%
Ranking of countries by current statistics by years