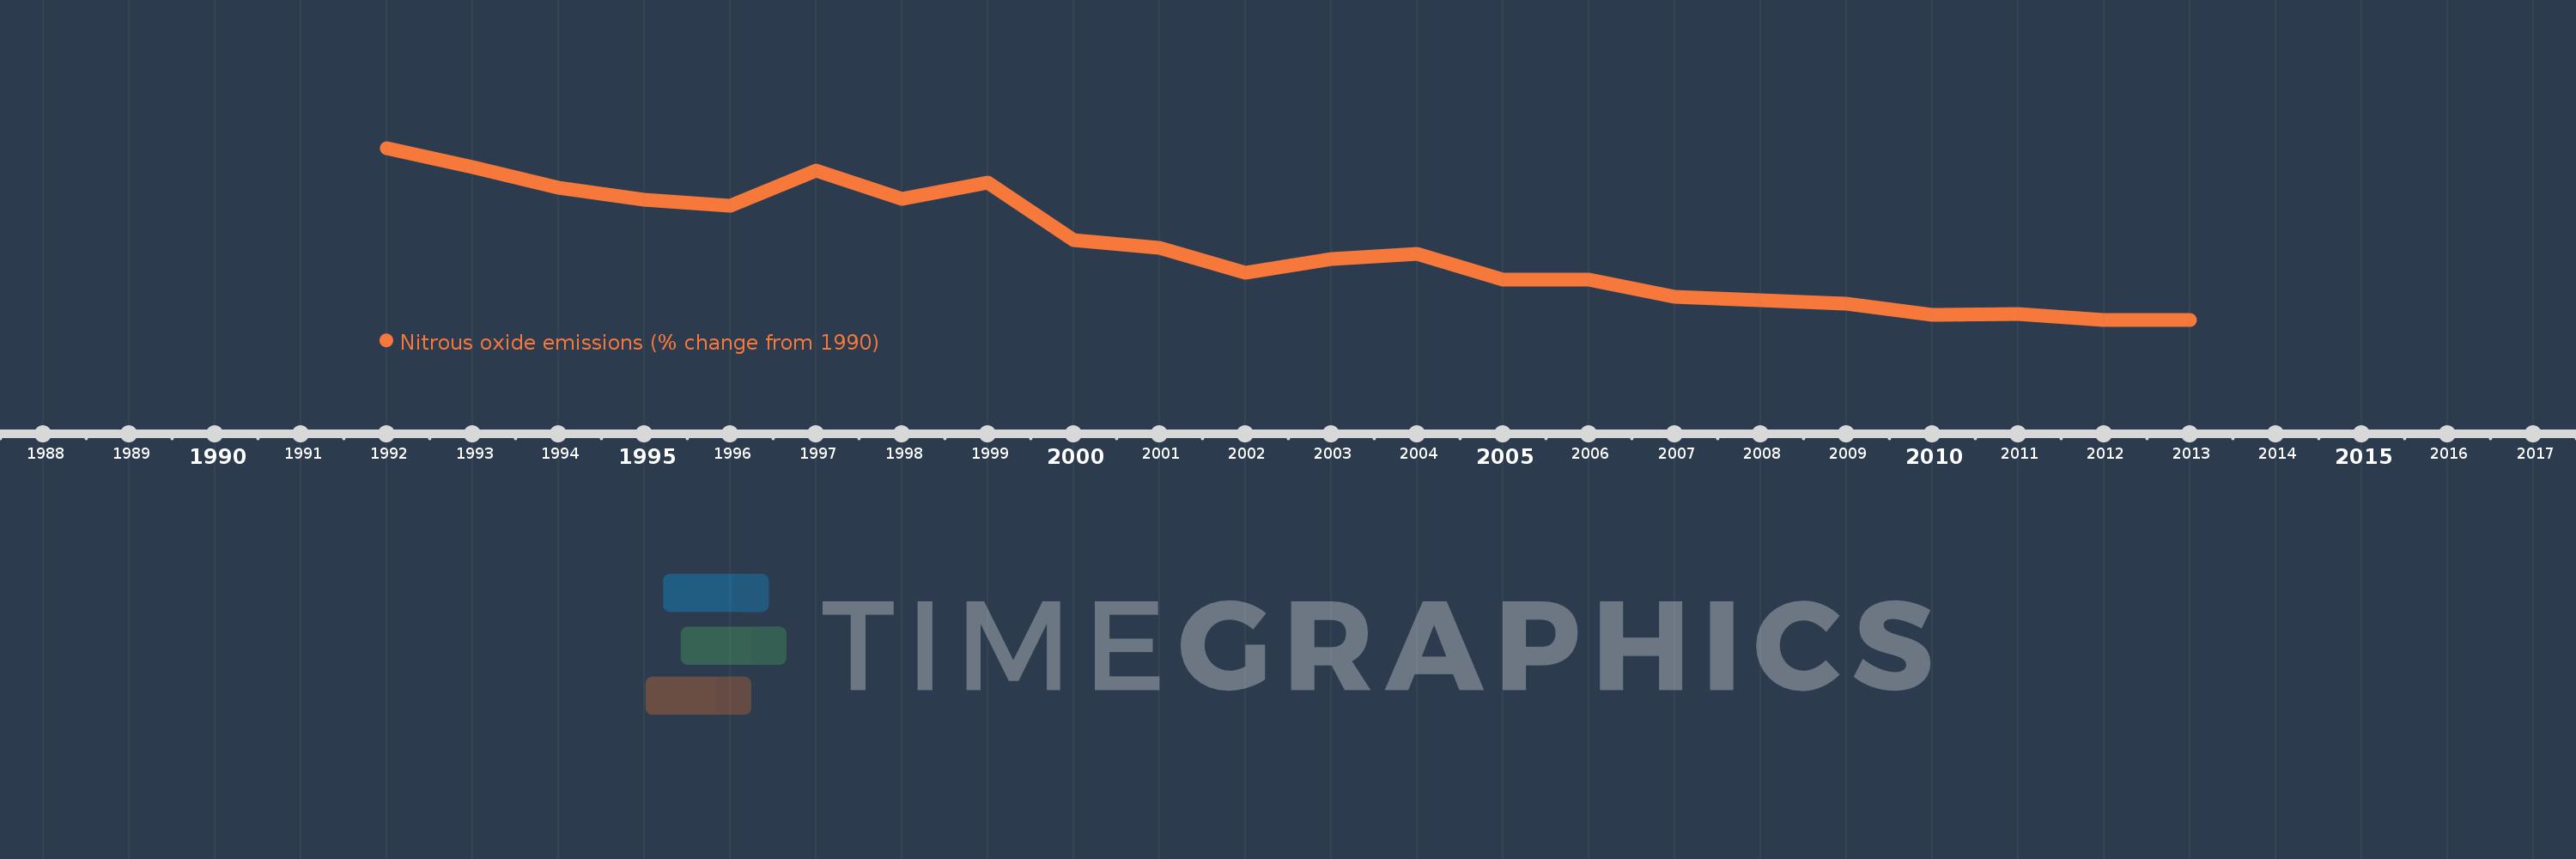
This timeline shows a graph from 1992 to 2013 of Europe & Central Asia. No data until 1991. Number of actual observations by date: 22.
Source name:
World Development Indicators
Source organization:
World Bank staff estimates from original source: European Commission, Joint Research Centre (JRC)/Netherlands Environmental Assessment Agency (PBL). Emission Database for Global Atmospheric Research (EDGAR): http://edgar.jrc.ec.europa.eu/.
Categories, topics:
Climate Change, Environment
Last updated:
apr 23, 2017
Indicators value changes by year
Meaning:
-26.892
Minimum:
-41.245
jan 1, 2012
Maximum:
-6.768
jan 1, 1992
At the date of observation
Value
Absolute change
Change from the previous value
jan 1, 1992
-6.768
-6.768
0.0%
jan 1, 1993
-10.634
-3.866
57.12%
jan 1, 1994
-14.695
-4.061
38.19%
jan 1, 1995
-17.122
-2.427
16.51%
jan 1, 1996
-18.315
-1.193
6.97%
jan 1, 1997
-11.293
+7.022
-38.34%
jan 1, 1998
-16.992
-5.699
50.47%
jan 1, 1999
-13.637
+3.356
-19.75%
jan 1, 2000
-25.316
-11.68
85.65%
jan 1, 2001
-26.846
-1.529
6.04%
jan 1, 2002
-31.78
-4.934
18.38%
jan 1, 2003
-29.073
+2.707
-8.52%
jan 1, 2004
-28.003
+1.07
-3.68%
jan 1, 2005
-33.246
-5.243
18.72%
jan 1, 2006
-33.178
+0.069
-0.21%
jan 1, 2007
-36.624
-3.447
10.39%
jan 1, 2008
-37.301
-0.677
1.85%
jan 1, 2009
-38.044
-0.742
1.99%
jan 1, 2010
-40.23
-2.186
5.75%
jan 1, 2011
-40.074
+0.156
-0.39%
jan 1, 2012
-41.245
-1.171
2.92%
jan 1, 2013
-41.214
+0.03
-0.07%
Ranking of countries by current statistics by years