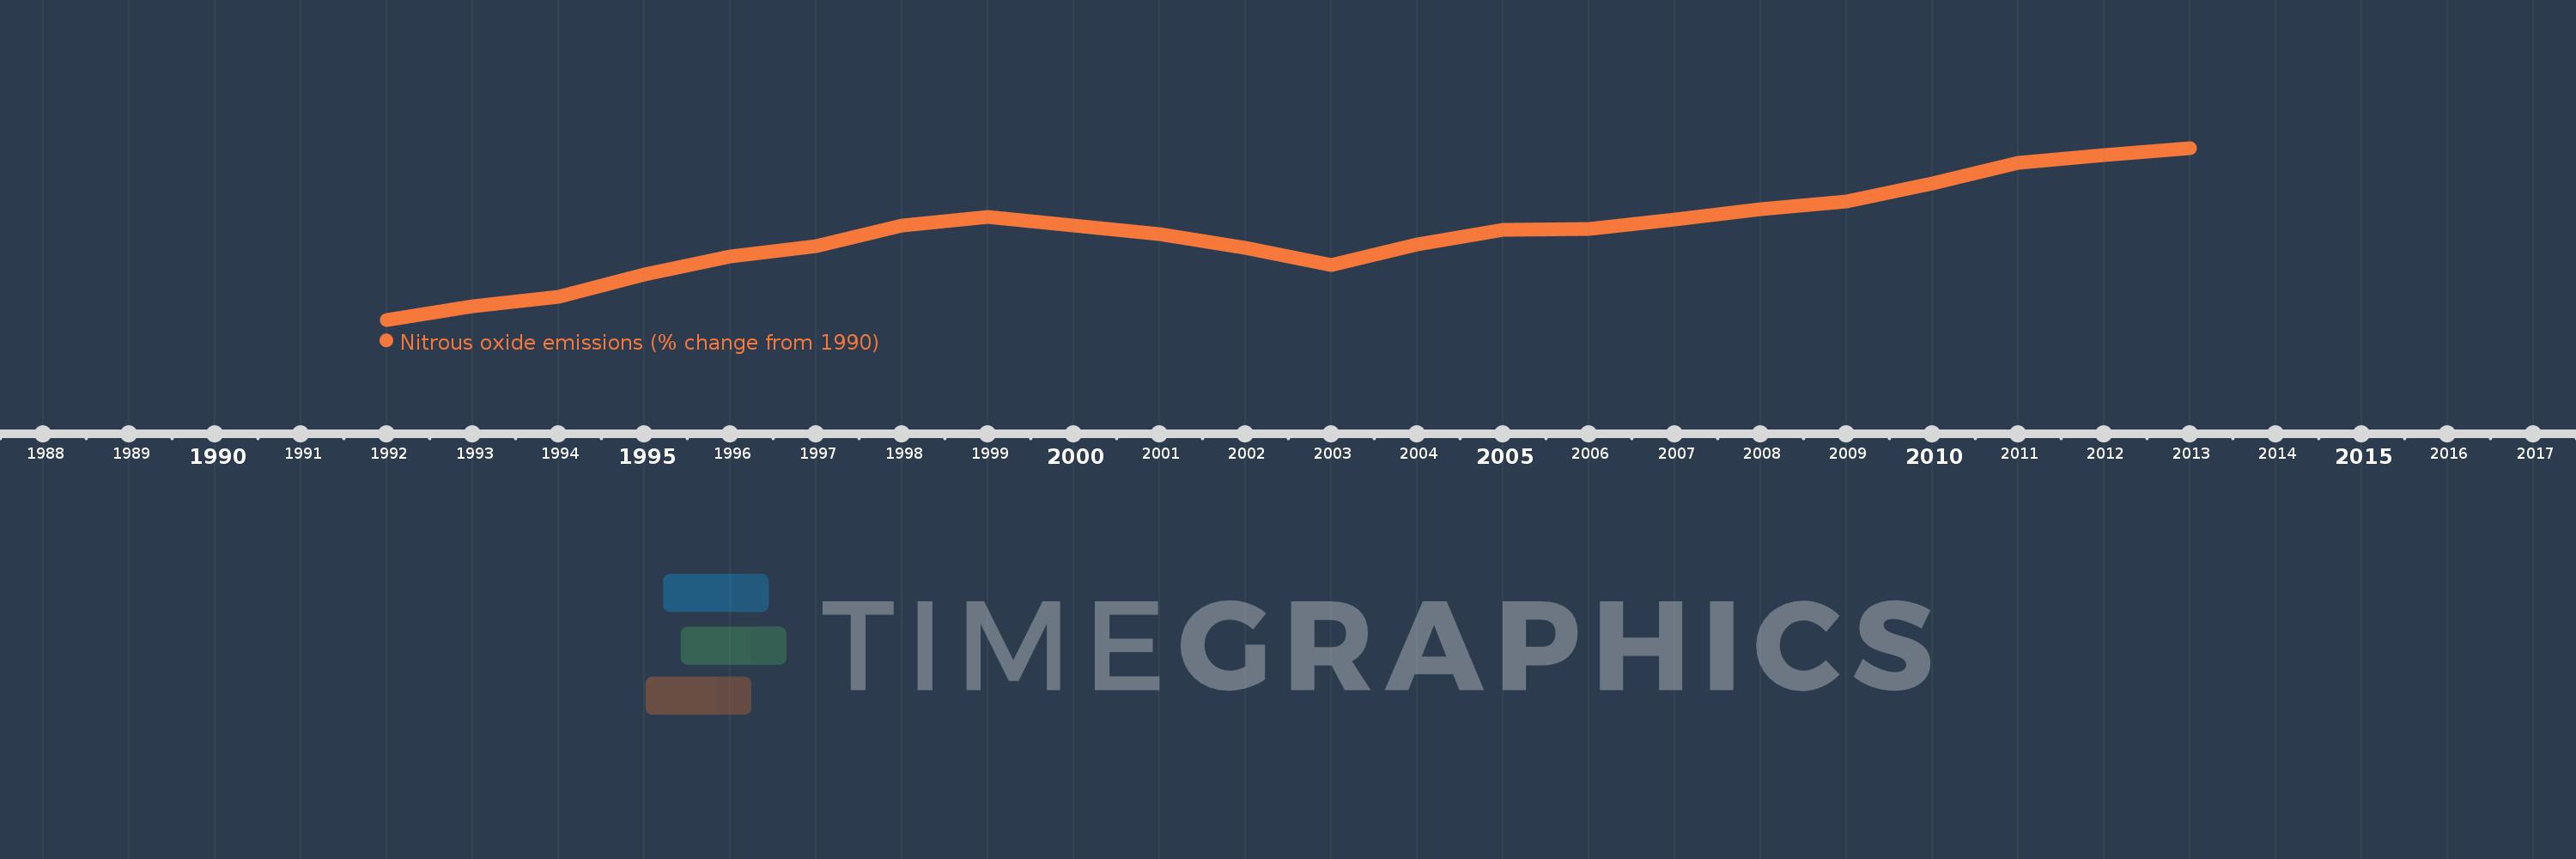
This timeline shows a graph from 1992 to 2013 of India. No data until 1991. Number of actual observations by date: 22.
Source name:
World Development Indicators
Source organization:
World Bank staff estimates from original source: European Commission, Joint Research Centre (JRC)/Netherlands Environmental Assessment Agency (PBL). Emission Database for Global Atmospheric Research (EDGAR): http://edgar.jrc.ec.europa.eu/.
Categories, topics:
Climate Change, Environment
Last updated:
apr 23, 2017
Indicators value changes by year
Meaning:
22.975
Minimum:
3.668
jan 1, 1992
Maximum:
41.366
jan 1, 2013
At the date of observation
Value
Absolute change
Change from the previous value
jan 1, 1992
3.668
+3.668
0.0%
jan 1, 1993
6.642
+2.974
81.09%
jan 1, 1994
8.676
+2.034
30.63%
jan 1, 1995
13.57
+4.894
56.4%
jan 1, 1996
17.593
+4.023
29.65%
jan 1, 1997
19.789
+2.196
12.48%
jan 1, 1998
24.41
+4.621
23.35%
jan 1, 1999
26.291
+1.881
7.71%
jan 1, 2000
24.294
-1.998
-7.6%
jan 1, 2001
22.466
-1.828
-7.52%
jan 1, 2002
19.425
-3.041
-13.53%
jan 1, 2003
15.612
-3.813
-19.63%
jan 1, 2004
20.142
+4.529
29.01%
jan 1, 2005
23.353
+3.212
15.94%
jan 1, 2006
23.579
+0.226
0.97%
jan 1, 2007
25.679
+2.101
8.91%
jan 1, 2008
27.868
+2.189
8.52%
jan 1, 2009
29.685
+1.817
6.52%
jan 1, 2010
33.587
+3.902
13.14%
jan 1, 2011
38.053
+4.466
13.3%
jan 1, 2012
39.71
+1.657
4.35%
jan 1, 2013
41.366
+1.657
4.17%
Ranking of countries by current statistics by years