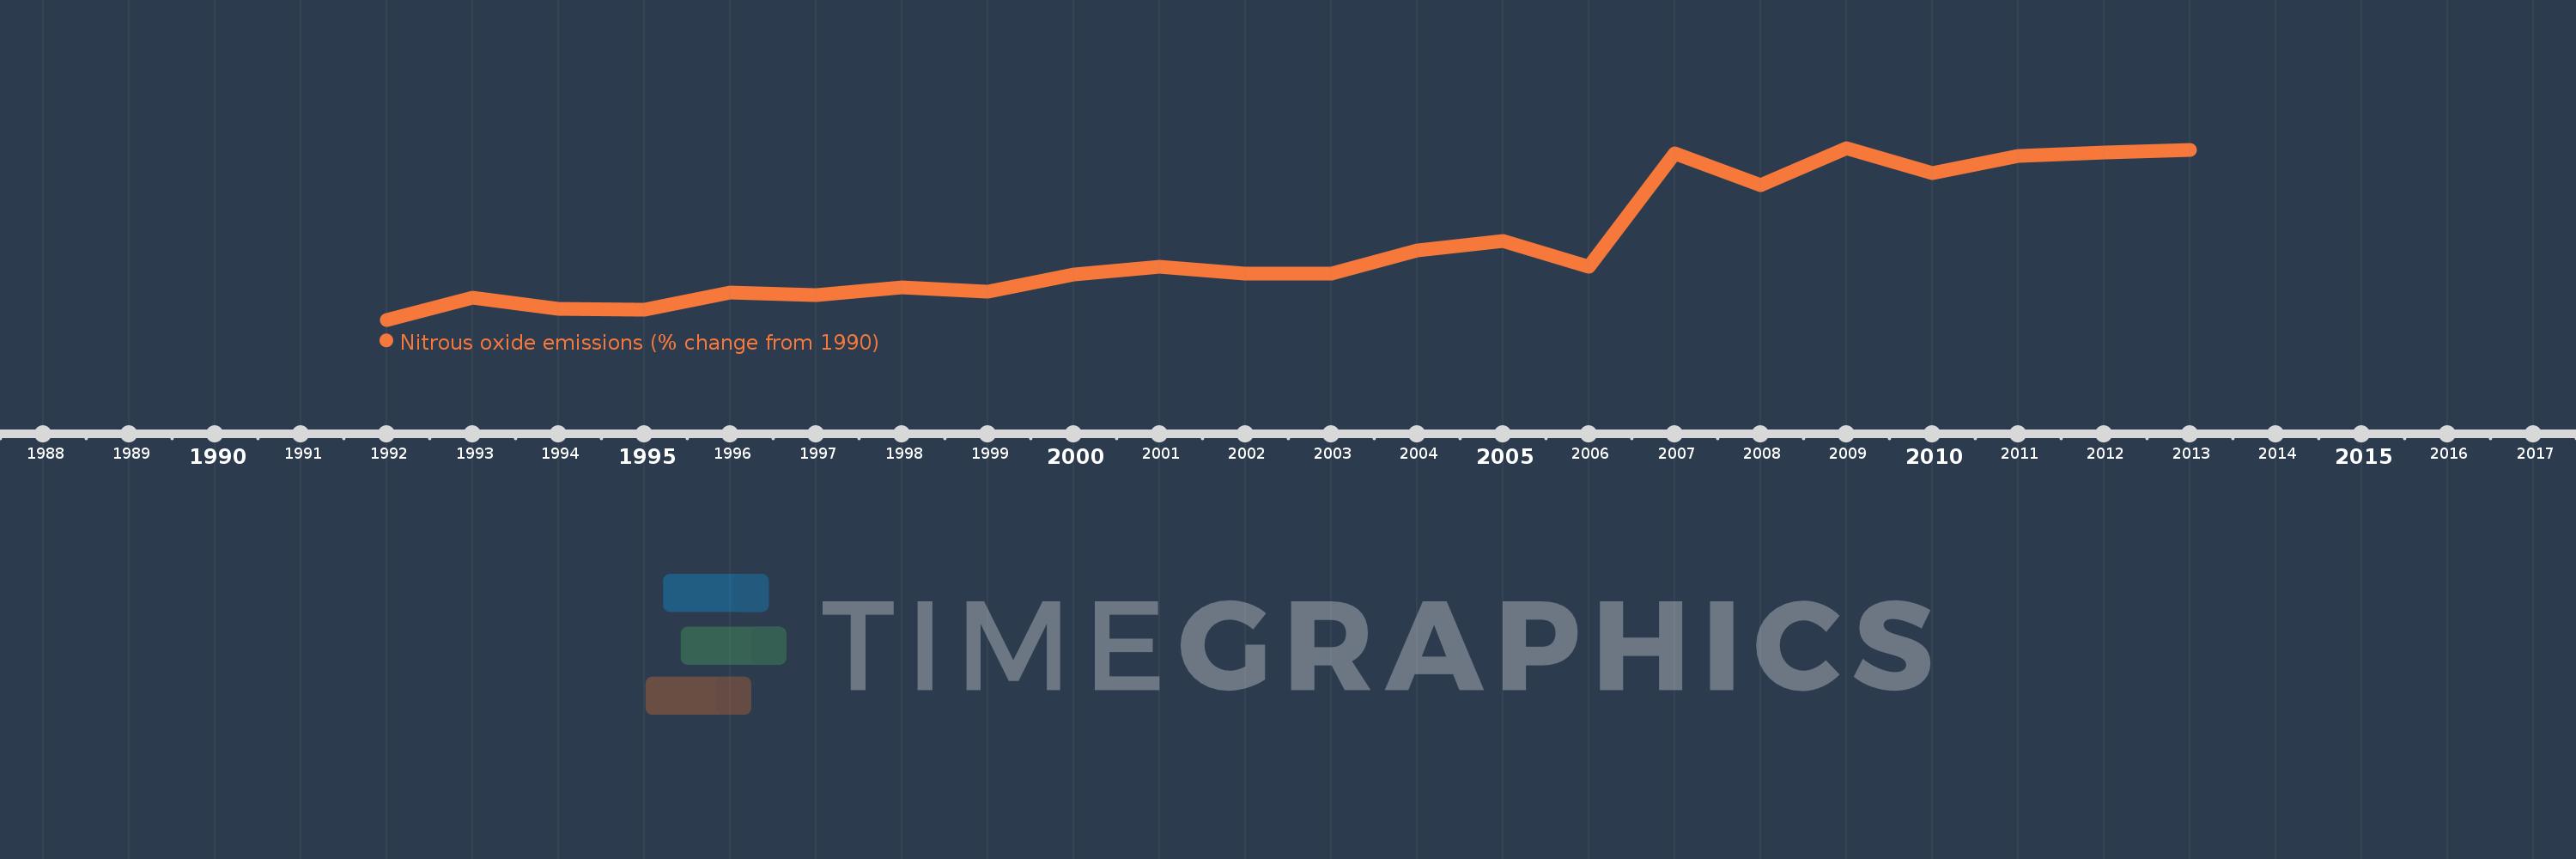
This timeline shows a graph from 1992 to 2013 of Chad. No data until 1991. Number of actual observations by date: 22.
Source name:
World Development Indicators
Source organization:
World Bank staff estimates from original source: European Commission, Joint Research Centre (JRC)/Netherlands Environmental Assessment Agency (PBL). Emission Database for Global Atmospheric Research (EDGAR): http://edgar.jrc.ec.europa.eu/.
Categories, topics:
Climate Change, Environment
Last updated:
apr 23, 2017
Indicators value changes by year
Meaning:
25.255
Minimum:
-22.644
jan 1, 1992
Maximum:
85.829
jan 1, 2009
At the date of observation
Value
Absolute change
Change from the previous value
jan 1, 1992
-22.644
-22.644
0.0%
jan 1, 1993
-8.539
+14.105
-62.29%
jan 1, 1994
-15.522
-6.983
81.77%
jan 1, 1995
-16.116
-0.594
3.83%
jan 1, 1996
-5.243
+10.873
-67.47%
jan 1, 1997
-6.896
-1.653
31.53%
jan 1, 1998
-2.104
+4.792
-69.49%
jan 1, 1999
-4.948
-2.844
135.17%
jan 1, 2000
6.077
+11.025
-222.81%
jan 1, 2001
11.072
+4.995
82.19%
jan 1, 2002
6.502
-4.57
-41.27%
jan 1, 2003
6.737
+0.236
3.62%
jan 1, 2004
21.109
+14.371
213.31%
jan 1, 2005
27.261
+6.152
29.15%
jan 1, 2006
10.789
-16.472
-60.42%
jan 1, 2007
82.165
+71.376
661.55%
jan 1, 2008
62.239
-19.926
-24.25%
jan 1, 2009
85.829
+23.59
37.9%
jan 1, 2010
69.76
-16.069
-18.72%
jan 1, 2011
80.883
+11.123
15.95%
jan 1, 2012
82.692
+1.809
2.24%
jan 1, 2013
84.501
+1.809
2.19%
Ranking of countries by current statistics by years