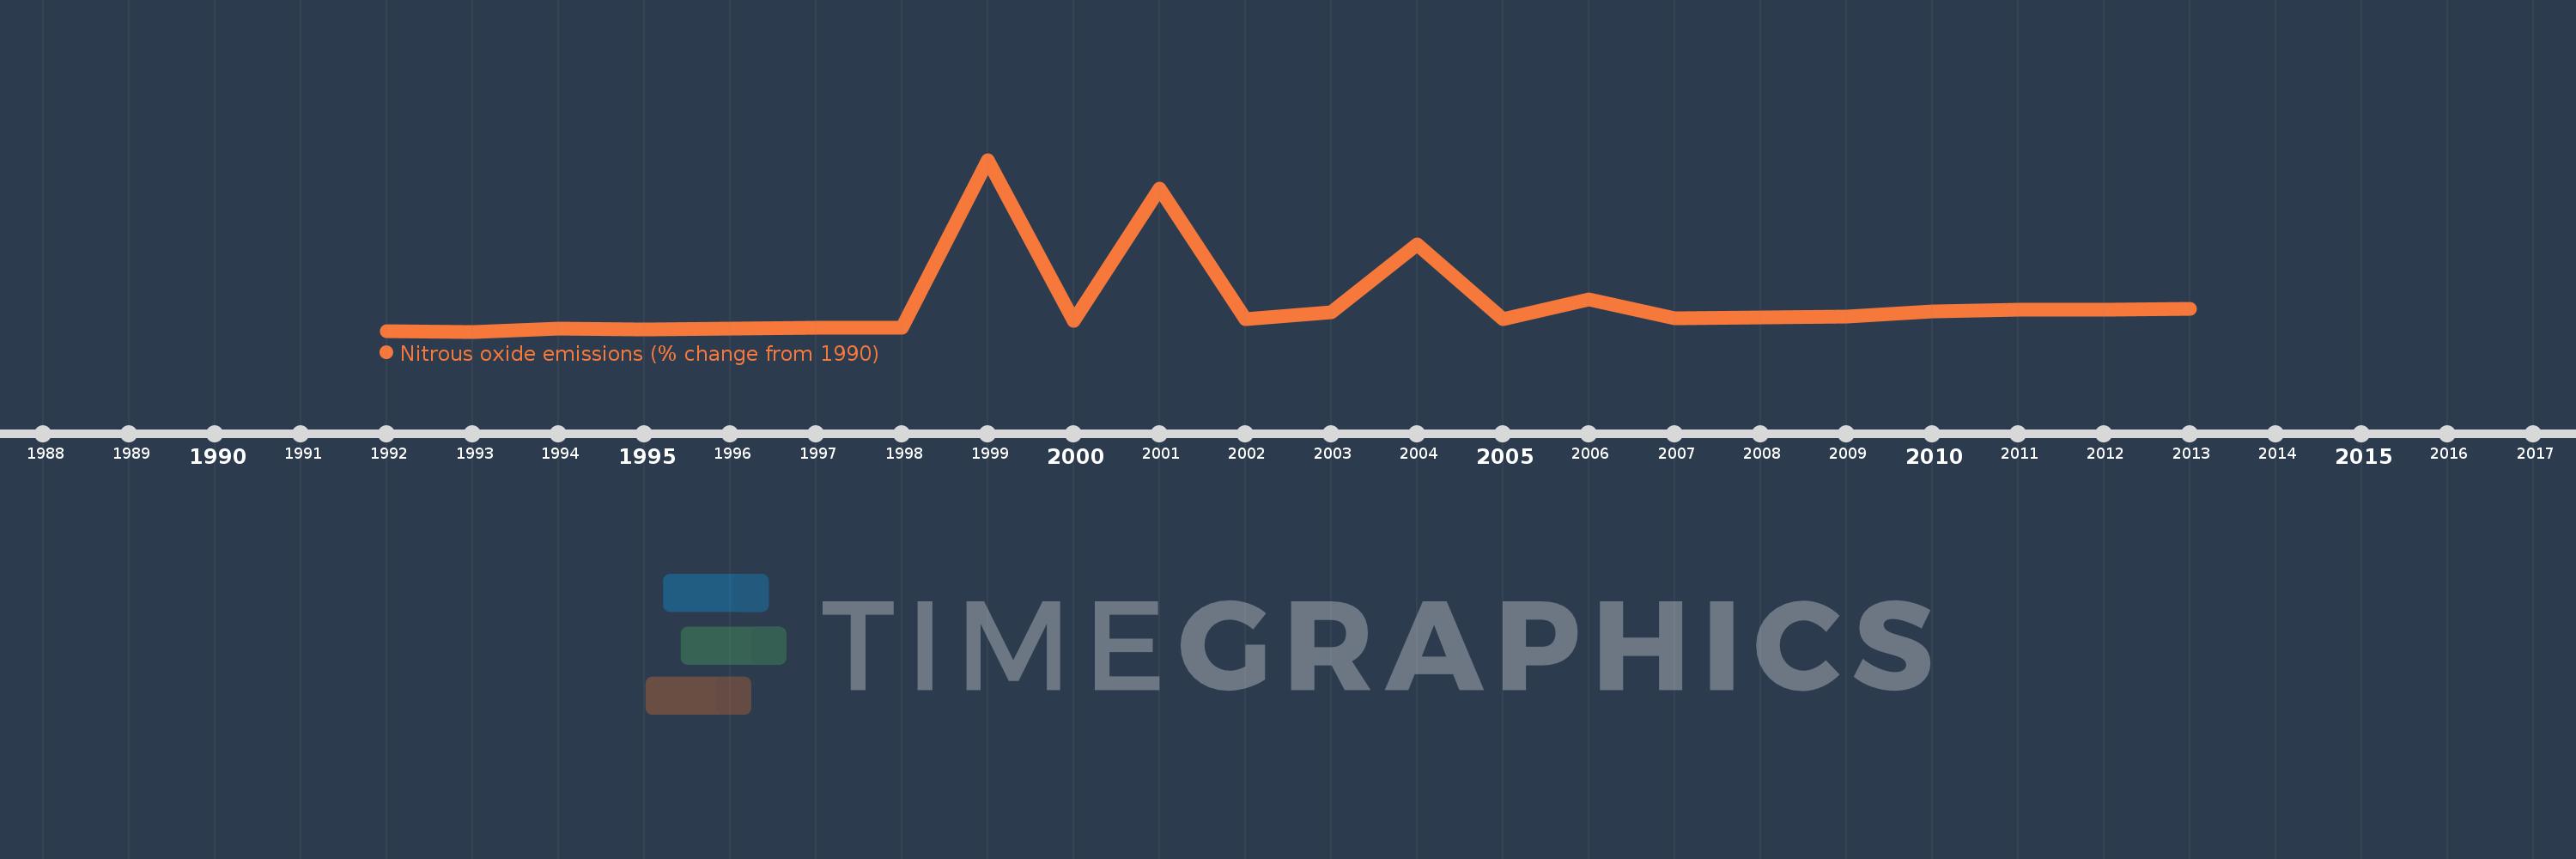
This timeline shows a graph from 1992 to 2013 of Guatemala. No data until 1991. Number of actual observations by date: 22.
Source name:
World Development Indicators
Source organization:
World Bank staff estimates from original source: European Commission, Joint Research Centre (JRC)/Netherlands Environmental Assessment Agency (PBL). Emission Database for Global Atmospheric Research (EDGAR): http://edgar.jrc.ec.europa.eu/.
Categories, topics:
Climate Change, Environment
Last updated:
apr 23, 2017
Indicators value changes by year
Meaning:
105.021
Minimum:
10.269
jan 1, 1993
Maximum:
574.16
jan 1, 1999
At the date of observation
Value
Absolute change
Change from the previous value
jan 1, 1992
12.095
+12.095
0.0%
jan 1, 1993
10.269
-1.826
-15.1%
jan 1, 1994
19.55
+9.281
90.37%
jan 1, 1995
18.68
-0.87
-4.45%
jan 1, 1996
20.494
+1.814
9.71%
jan 1, 1997
22.519
+2.025
9.88%
jan 1, 1998
21.785
-0.734
-3.26%
jan 1, 1999
574.16
+552.374
2.54K%
jan 1, 2000
46.594
-527.566
-91.88%
jan 1, 2001
479.926
+433.332
930.02%
jan 1, 2002
51.016
-428.91
-89.37%
jan 1, 2003
74.038
+23.022
45.13%
jan 1, 2004
296.216
+222.178
300.09%
jan 1, 2005
51.68
-244.536
-82.55%
jan 1, 2006
117.025
+65.346
126.44%
jan 1, 2007
53.596
-63.429
-54.2%
jan 1, 2008
56.501
+2.905
5.42%
jan 1, 2009
58.416
+1.915
3.39%
jan 1, 2010
77.467
+19.051
32.61%
jan 1, 2011
81.0
+3.533
4.56%
jan 1, 2012
82.81
+1.81
2.23%
jan 1, 2013
84.62
+1.81
2.19%
Ranking of countries by current statistics by years