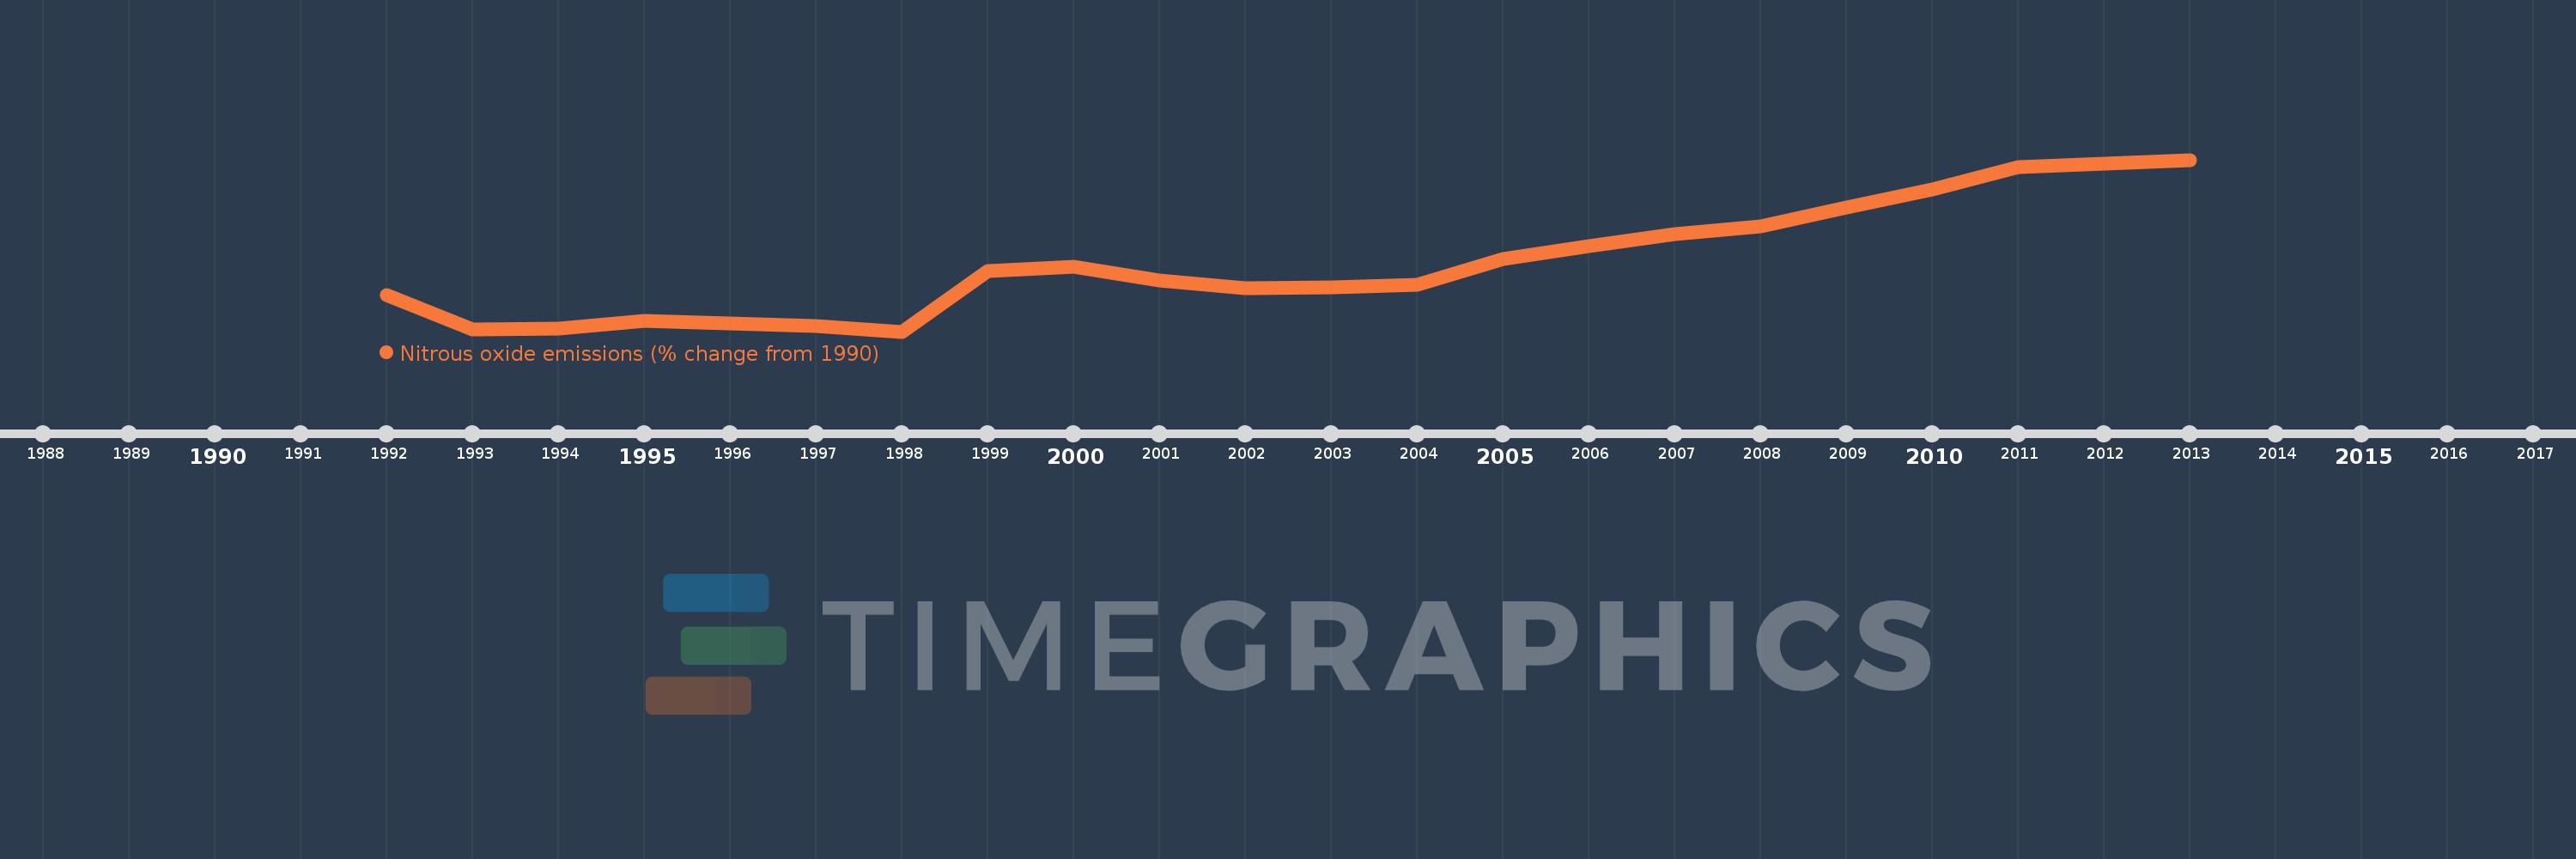
This timeline shows a graph from 1992 to 2013 of Bermuda. No data until 1991. Number of actual observations by date: 22.
Source name:
World Development Indicators
Source organization:
World Bank staff estimates from original source: European Commission, Joint Research Centre (JRC)/Netherlands Environmental Assessment Agency (PBL). Emission Database for Global Atmospheric Research (EDGAR): http://edgar.jrc.ec.europa.eu/.
Categories, topics:
Climate Change, Environment
Last updated:
apr 23, 2017
Indicators value changes by year
Meaning:
7.627
Minimum:
-18.482
jan 1, 1998
Maximum:
46.896
jan 1, 2013
At the date of observation
Value
Absolute change
Change from the previous value
jan 1, 1992
-4.618
-4.618
0.0%
jan 1, 1993
-17.565
-12.947
280.34%
jan 1, 1994
-17.47
+0.095
-0.54%
jan 1, 1995
-14.519
+2.951
-16.89%
jan 1, 1996
-15.32
-0.801
5.52%
jan 1, 1997
-16.295
-0.975
6.37%
jan 1, 1998
-18.482
-2.187
13.42%
jan 1, 1999
4.687
+23.169
-125.36%
jan 1, 2000
6.355
+1.668
35.58%
jan 1, 2001
1.113
-5.241
-82.48%
jan 1, 2002
-1.931
-3.044
-273.41%
jan 1, 2003
-1.71
+0.221
-11.45%
jan 1, 2004
-0.653
+1.056
-61.79%
jan 1, 2005
9.248
+9.901
-1.52K%
jan 1, 2006
13.888
+4.64
50.18%
jan 1, 2007
18.656
+4.768
34.33%
jan 1, 2008
21.579
+2.923
15.67%
jan 1, 2009
28.82
+7.242
33.56%
jan 1, 2010
35.642
+6.822
23.67%
jan 1, 2011
44.016
+8.374
23.49%
jan 1, 2012
45.456
+1.44
3.27%
jan 1, 2013
46.896
+1.44
3.17%
Ranking of countries by current statistics by years