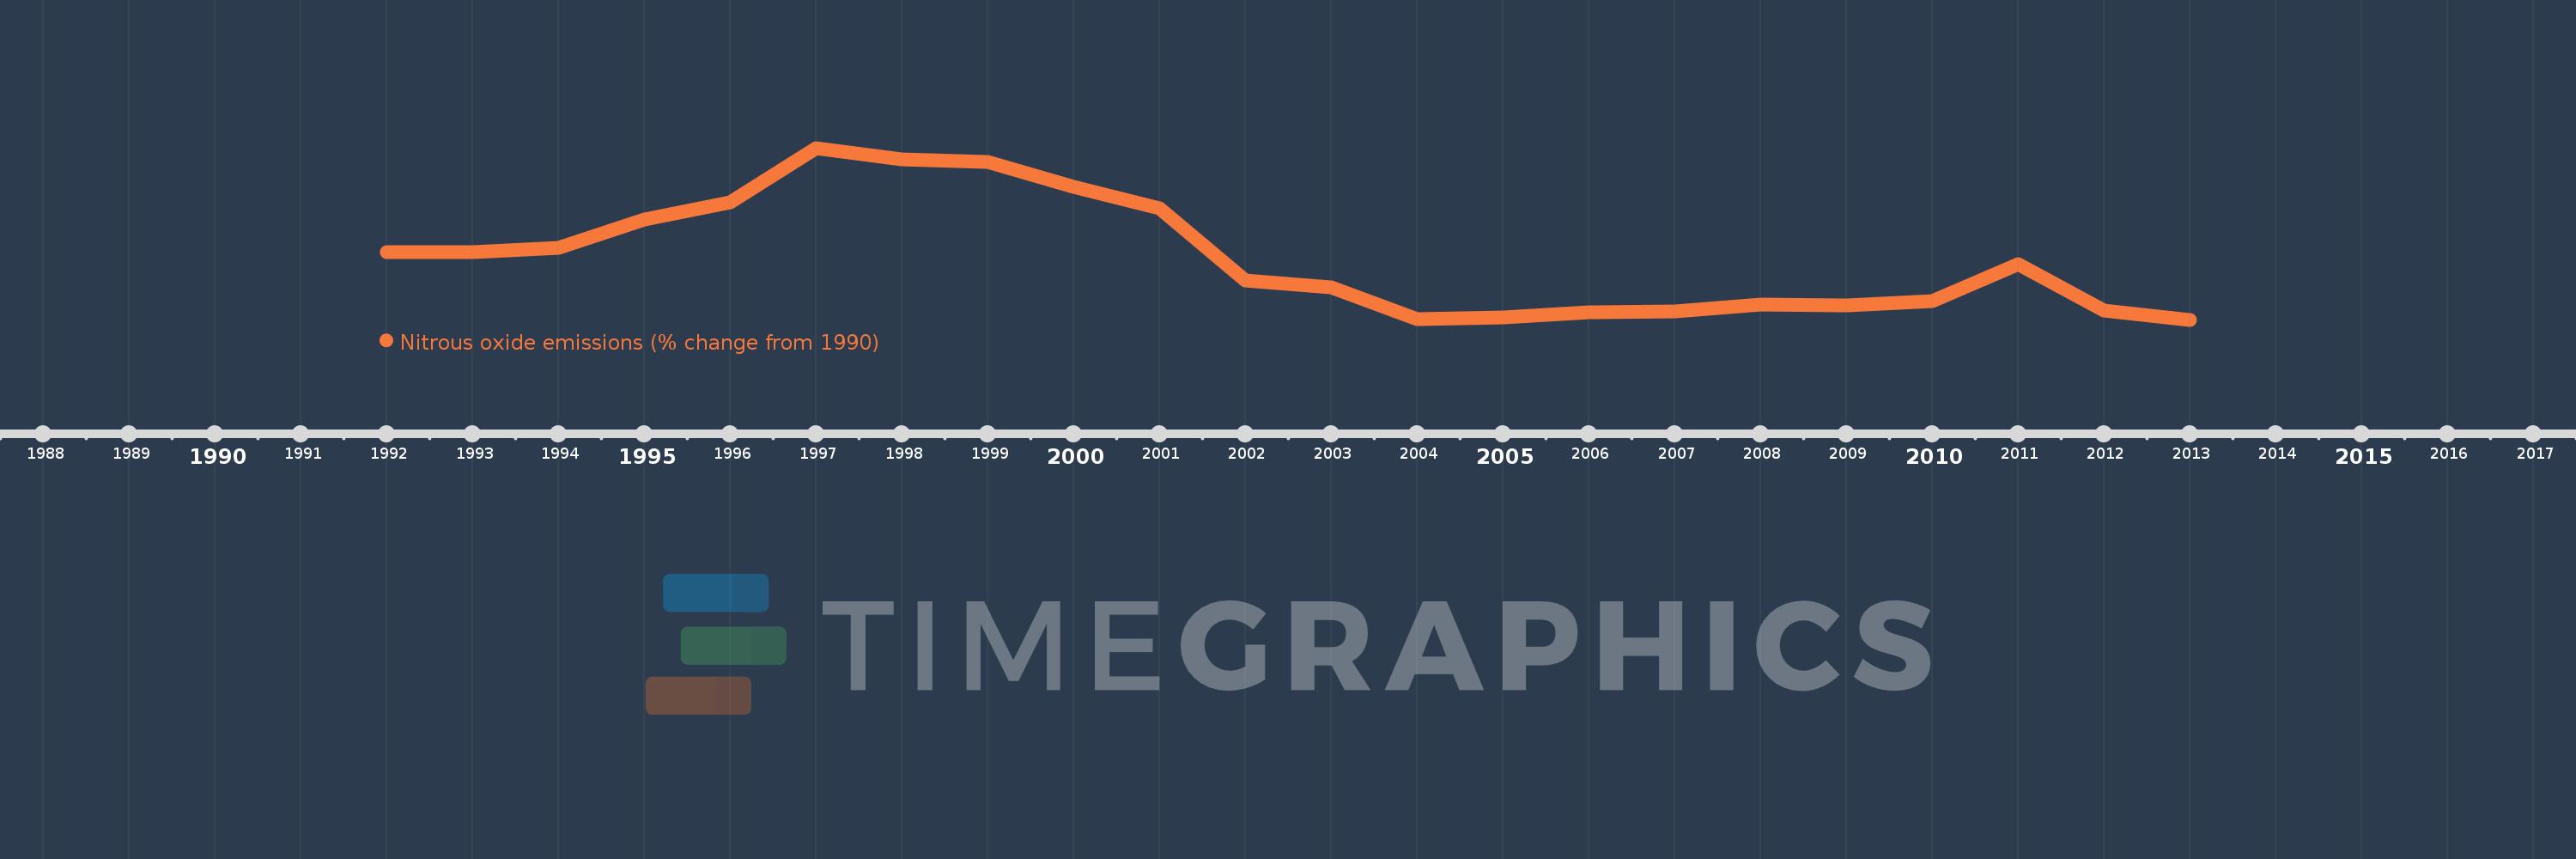
This timeline shows a graph from 1992 to 2013 of Belgium. No data until 1991. Number of actual observations by date: 22.
Source name:
World Development Indicators
Source organization:
World Bank staff estimates from original source: European Commission, Joint Research Centre (JRC)/Netherlands Environmental Assessment Agency (PBL). Emission Database for Global Atmospheric Research (EDGAR): http://edgar.jrc.ec.europa.eu/.
Categories, topics:
Climate Change, Environment
Last updated:
apr 23, 2017
Indicators value changes by year
Meaning:
5.033
Minimum:
-13.483
jan 1, 2013
Maximum:
37.835
jan 1, 1997
At the date of observation
Value
Absolute change
Change from the previous value
jan 1, 1992
6.674
+6.674
0.0%
jan 1, 1993
6.613
-0.061
-0.91%
jan 1, 1994
8.116
+1.502
22.72%
jan 1, 1995
16.568
+8.452
104.15%
jan 1, 1996
21.711
+5.144
31.05%
jan 1, 1997
37.835
+16.124
74.27%
jan 1, 1998
34.426
-3.409
-9.01%
jan 1, 1999
33.576
-0.85
-2.47%
jan 1, 2000
26.169
-7.406
-22.06%
jan 1, 2001
19.861
-6.308
-24.11%
jan 1, 2002
-1.79
-21.651
-109.01%
jan 1, 2003
-3.798
-2.007
112.12%
jan 1, 2004
-13.192
-9.394
247.36%
jan 1, 2005
-12.86
+0.332
-2.51%
jan 1, 2006
-11.246
+1.614
-12.55%
jan 1, 2007
-11.073
+0.173
-1.54%
jan 1, 2008
-8.856
+2.217
-20.02%
jan 1, 2009
-9.137
-0.281
3.17%
jan 1, 2010
-7.81
+1.327
-14.52%
jan 1, 2011
3.068
+10.879
-139.29%
jan 1, 2012
-10.647
-13.715
-446.97%
jan 1, 2013
-13.483
-2.836
26.64%
Ranking of countries by current statistics by years