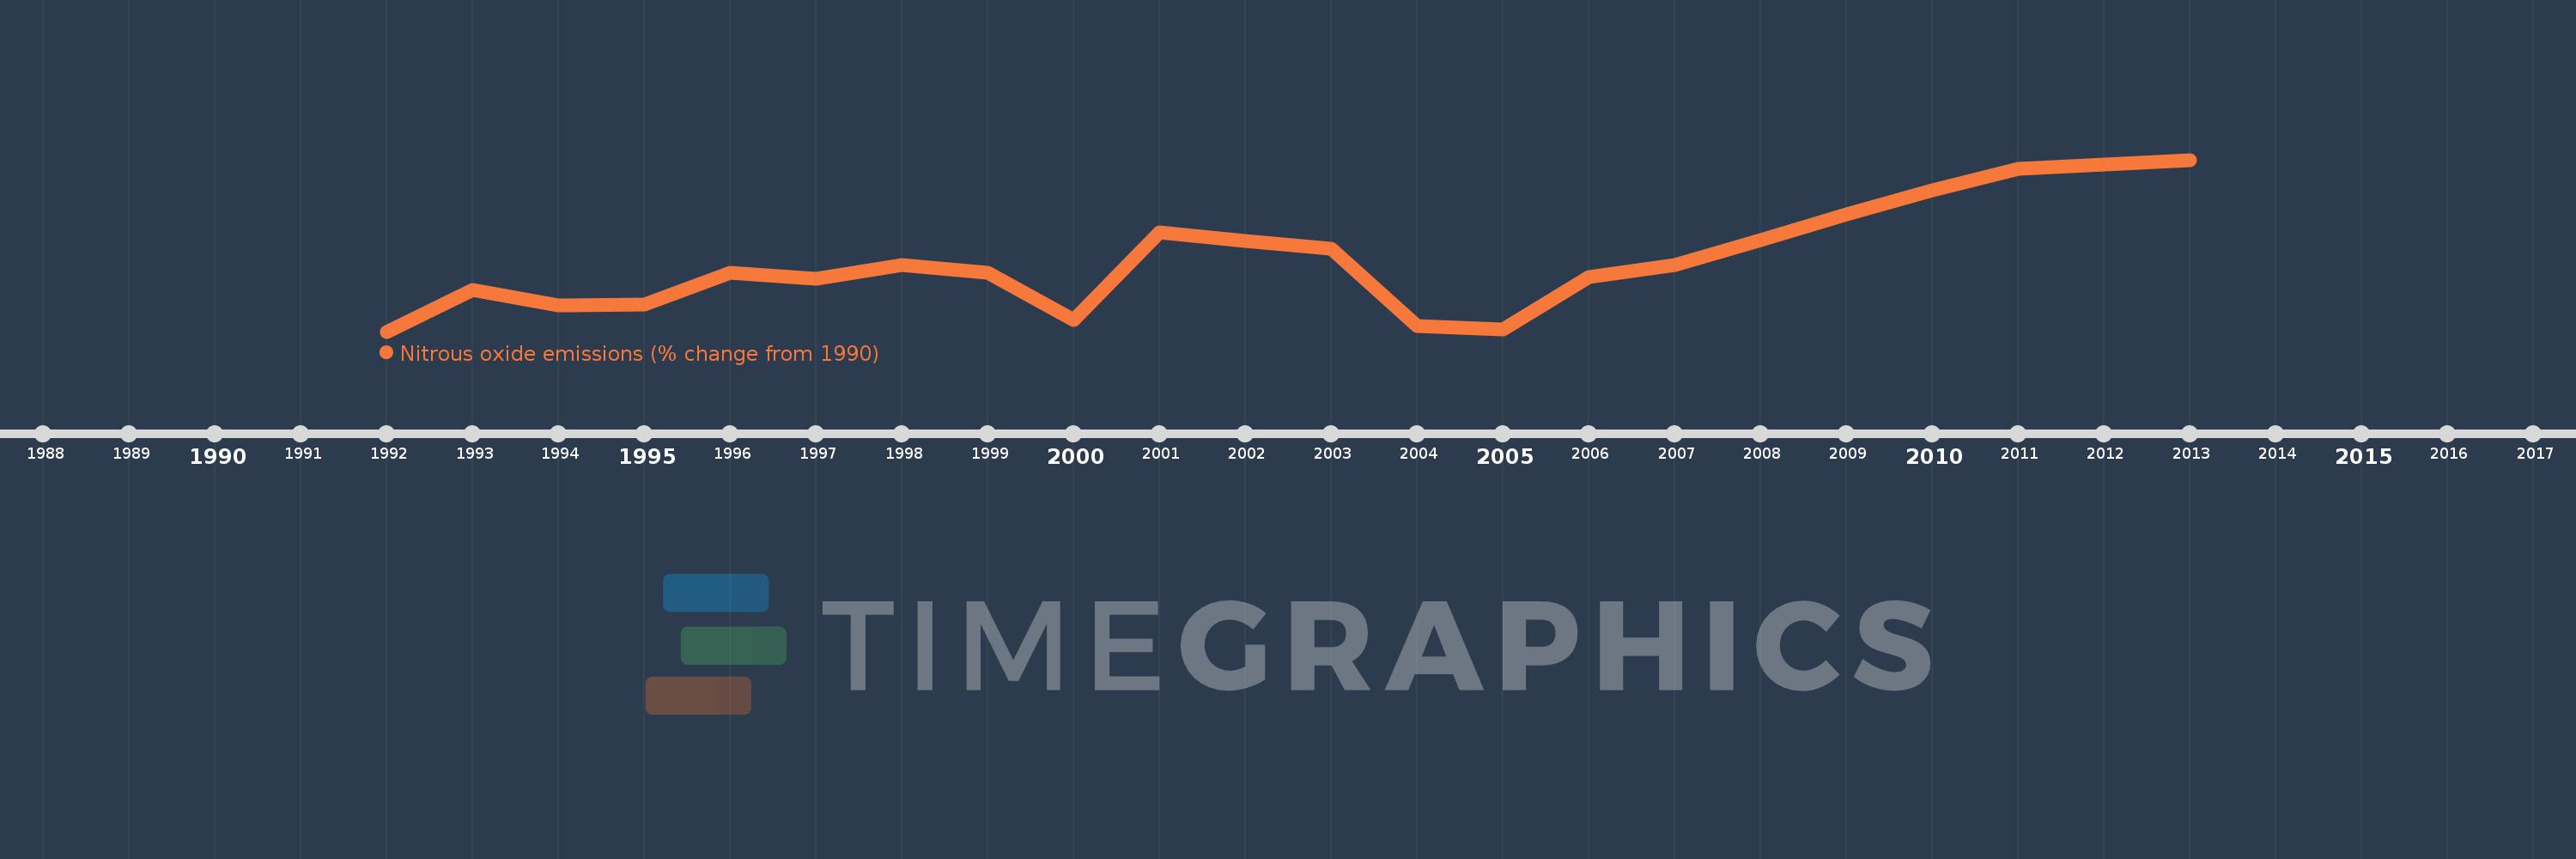
This timeline shows a graph from 1992 to 2013 of Cote d'Ivoire. No data until 1991. Number of actual observations by date: 22.
Source name:
World Development Indicators
Source organization:
World Bank staff estimates from original source: European Commission, Joint Research Centre (JRC)/Netherlands Environmental Assessment Agency (PBL). Emission Database for Global Atmospheric Research (EDGAR): http://edgar.jrc.ec.europa.eu/.
Categories, topics:
Climate Change, Environment
Last updated:
apr 23, 2017
Indicators value changes by year
Meaning:
3.387
Minimum:
-17.331
jan 1, 1992
Maximum:
31.714
jan 1, 2013
At the date of observation
Value
Absolute change
Change from the previous value
jan 1, 1992
-17.331
-17.331
0.0%
jan 1, 1993
-5.336
+11.995
-69.21%
jan 1, 1994
-9.916
-4.58
85.84%
jan 1, 1995
-9.62
+0.297
-2.99%
jan 1, 1996
-0.541
+9.079
-94.37%
jan 1, 1997
-2.197
-1.656
305.94%
jan 1, 1998
1.673
+3.87
-176.14%
jan 1, 1999
-0.551
-2.224
-132.94%
jan 1, 2000
-14.027
-13.476
2.45K%
jan 1, 2001
10.994
+25.021
-178.38%
jan 1, 2002
8.537
-2.458
-22.36%
jan 1, 2003
6.295
-2.242
-26.26%
jan 1, 2004
-15.797
-22.091
-350.95%
jan 1, 2005
-16.761
-0.964
6.11%
jan 1, 2006
-1.843
+14.918
-89.01%
jan 1, 2007
1.587
+3.43
-186.15%
jan 1, 2008
8.874
+7.287
459.04%
jan 1, 2009
16.084
+7.21
81.24%
jan 1, 2010
23.127
+7.044
43.79%
jan 1, 2011
29.131
+6.004
25.96%
jan 1, 2012
30.422
+1.291
4.43%
jan 1, 2013
31.714
+1.291
4.24%
Ranking of countries by current statistics by years