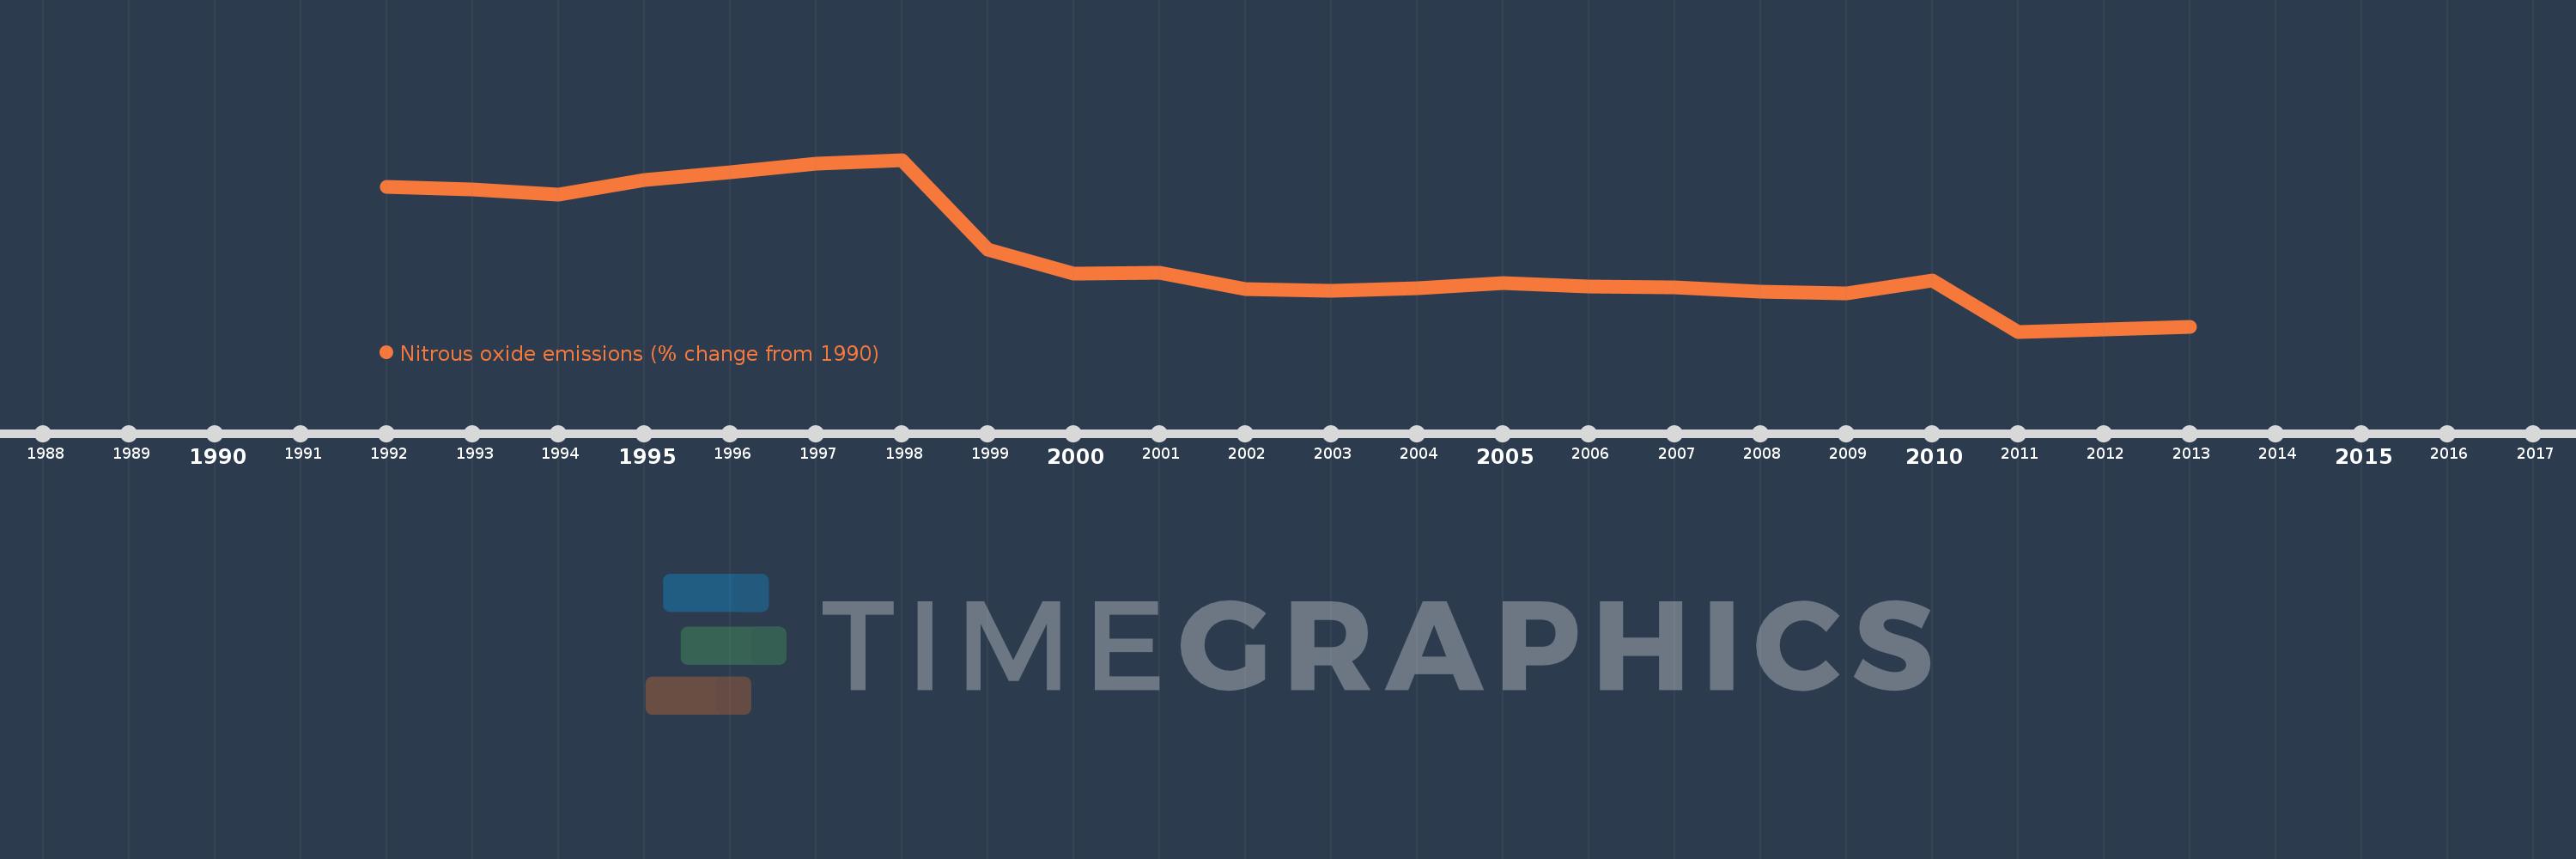
This timeline shows a graph from 1992 to 2013 of Germany. No data until 1991. Number of actual observations by date: 22.
Source name:
World Development Indicators
Source organization:
World Bank staff estimates from original source: European Commission, Joint Research Centre (JRC)/Netherlands Environmental Assessment Agency (PBL). Emission Database for Global Atmospheric Research (EDGAR): http://edgar.jrc.ec.europa.eu/.
Categories, topics:
Climate Change, Environment
Last updated:
apr 23, 2017
Indicators value changes by year
Meaning:
-19.469
Minimum:
-40.312
jan 1, 2011
Maximum:
6.754
jan 1, 1998
At the date of observation
Value
Absolute change
Change from the previous value
jan 1, 1992
-0.741
-0.741
0.0%
jan 1, 1993
-1.34
-0.598
80.76%
jan 1, 1994
-2.747
-1.407
105.04%
jan 1, 1995
1.119
+3.865
-140.72%
jan 1, 1996
3.271
+2.152
192.44%
jan 1, 1997
5.596
+2.326
71.1%
jan 1, 1998
6.754
+1.157
20.68%
jan 1, 1999
-17.75
-24.504
-362.82%
jan 1, 2000
-24.513
-6.763
38.1%
jan 1, 2001
-24.161
+0.353
-1.44%
jan 1, 2002
-28.753
-4.592
19.01%
jan 1, 2003
-29.088
-0.335
1.16%
jan 1, 2004
-28.355
+0.732
-2.52%
jan 1, 2005
-27.106
+1.249
-4.41%
jan 1, 2006
-27.916
-0.81
2.99%
jan 1, 2007
-28.11
-0.194
0.69%
jan 1, 2008
-29.449
-1.339
4.76%
jan 1, 2009
-29.902
-0.454
1.54%
jan 1, 2010
-26.228
+3.675
-12.29%
jan 1, 2011
-40.312
-14.084
53.7%
jan 1, 2012
-39.636
+0.676
-1.68%
jan 1, 2013
-38.96
+0.676
-1.71%
Ranking of countries by current statistics by years