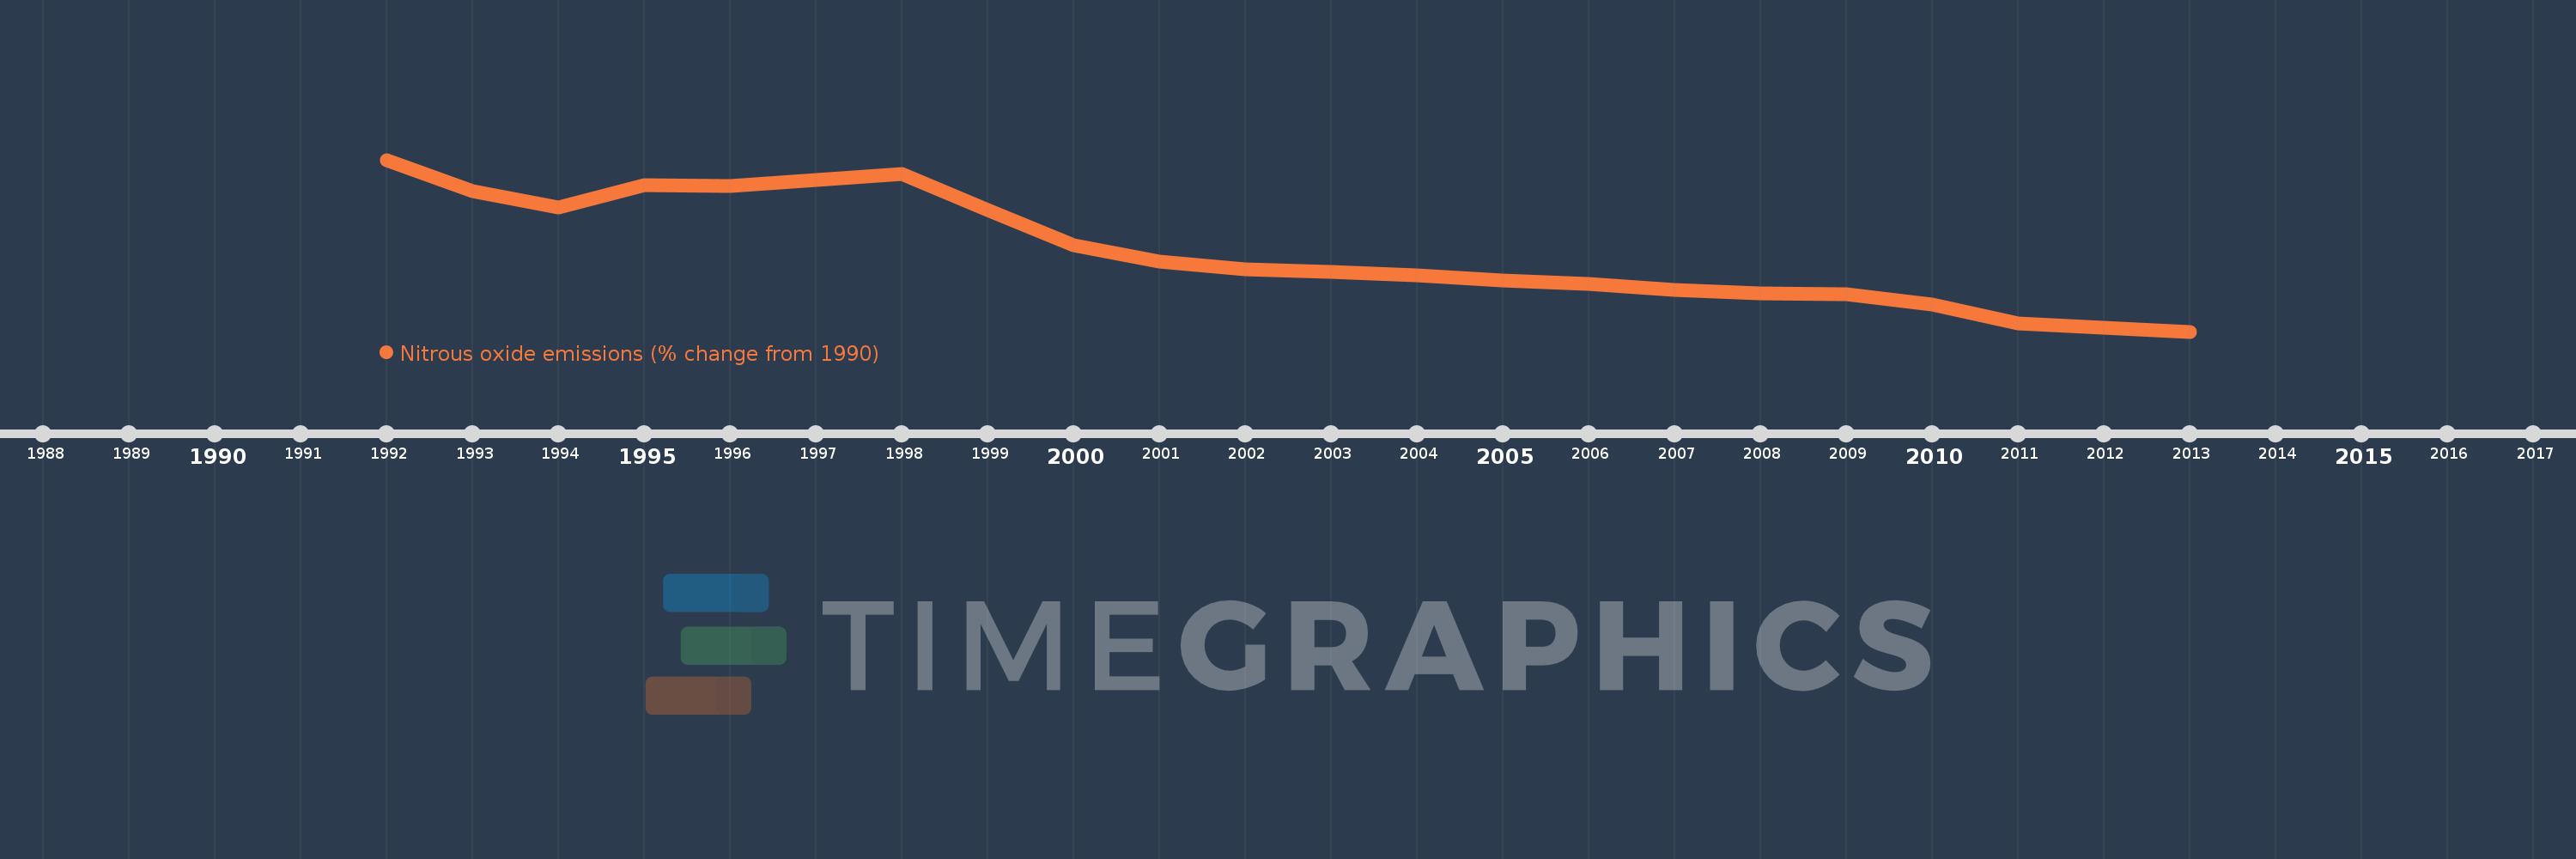
This timeline shows a graph from 1992 to 2013 of France. No data until 1991. Number of actual observations by date: 22.
Source name:
World Development Indicators
Source organization:
World Bank staff estimates from original source: European Commission, Joint Research Centre (JRC)/Netherlands Environmental Assessment Agency (PBL). Emission Database for Global Atmospheric Research (EDGAR): http://edgar.jrc.ec.europa.eu/.
Categories, topics:
Climate Change, Environment
Last updated:
apr 23, 2017
Indicators value changes by year
Meaning:
-25.859
Minimum:
-50.093
jan 1, 2013
Maximum:
2.29
jan 1, 1992
At the date of observation
Value
Absolute change
Change from the previous value
jan 1, 1992
2.29
+2.29
0.0%
jan 1, 1993
-7.235
-9.525
-415.91%
jan 1, 1994
-12.324
-5.09
70.35%
jan 1, 1995
-5.542
+6.783
-55.03%
jan 1, 1996
-5.771
-0.23
4.14%
jan 1, 1997
-3.801
+1.97
-34.13%
jan 1, 1998
-2.037
+1.764
-46.41%
jan 1, 1999
-13.022
-10.985
539.29%
jan 1, 2000
-23.697
-10.674
81.97%
jan 1, 2001
-28.658
-4.961
20.94%
jan 1, 2002
-31.074
-2.416
8.43%
jan 1, 2003
-31.94
-0.866
2.79%
jan 1, 2004
-32.967
-1.027
3.22%
jan 1, 2005
-34.451
-1.484
4.5%
jan 1, 2006
-35.478
-1.027
2.98%
jan 1, 2007
-37.464
-1.986
5.6%
jan 1, 2008
-38.436
-0.972
2.6%
jan 1, 2009
-38.782
-0.345
0.9%
jan 1, 2010
-41.901
-3.119
8.04%
jan 1, 2011
-47.644
-5.744
13.71%
jan 1, 2012
-48.869
-1.224
2.57%
jan 1, 2013
-50.093
-1.224
2.51%
Ranking of countries by current statistics by years