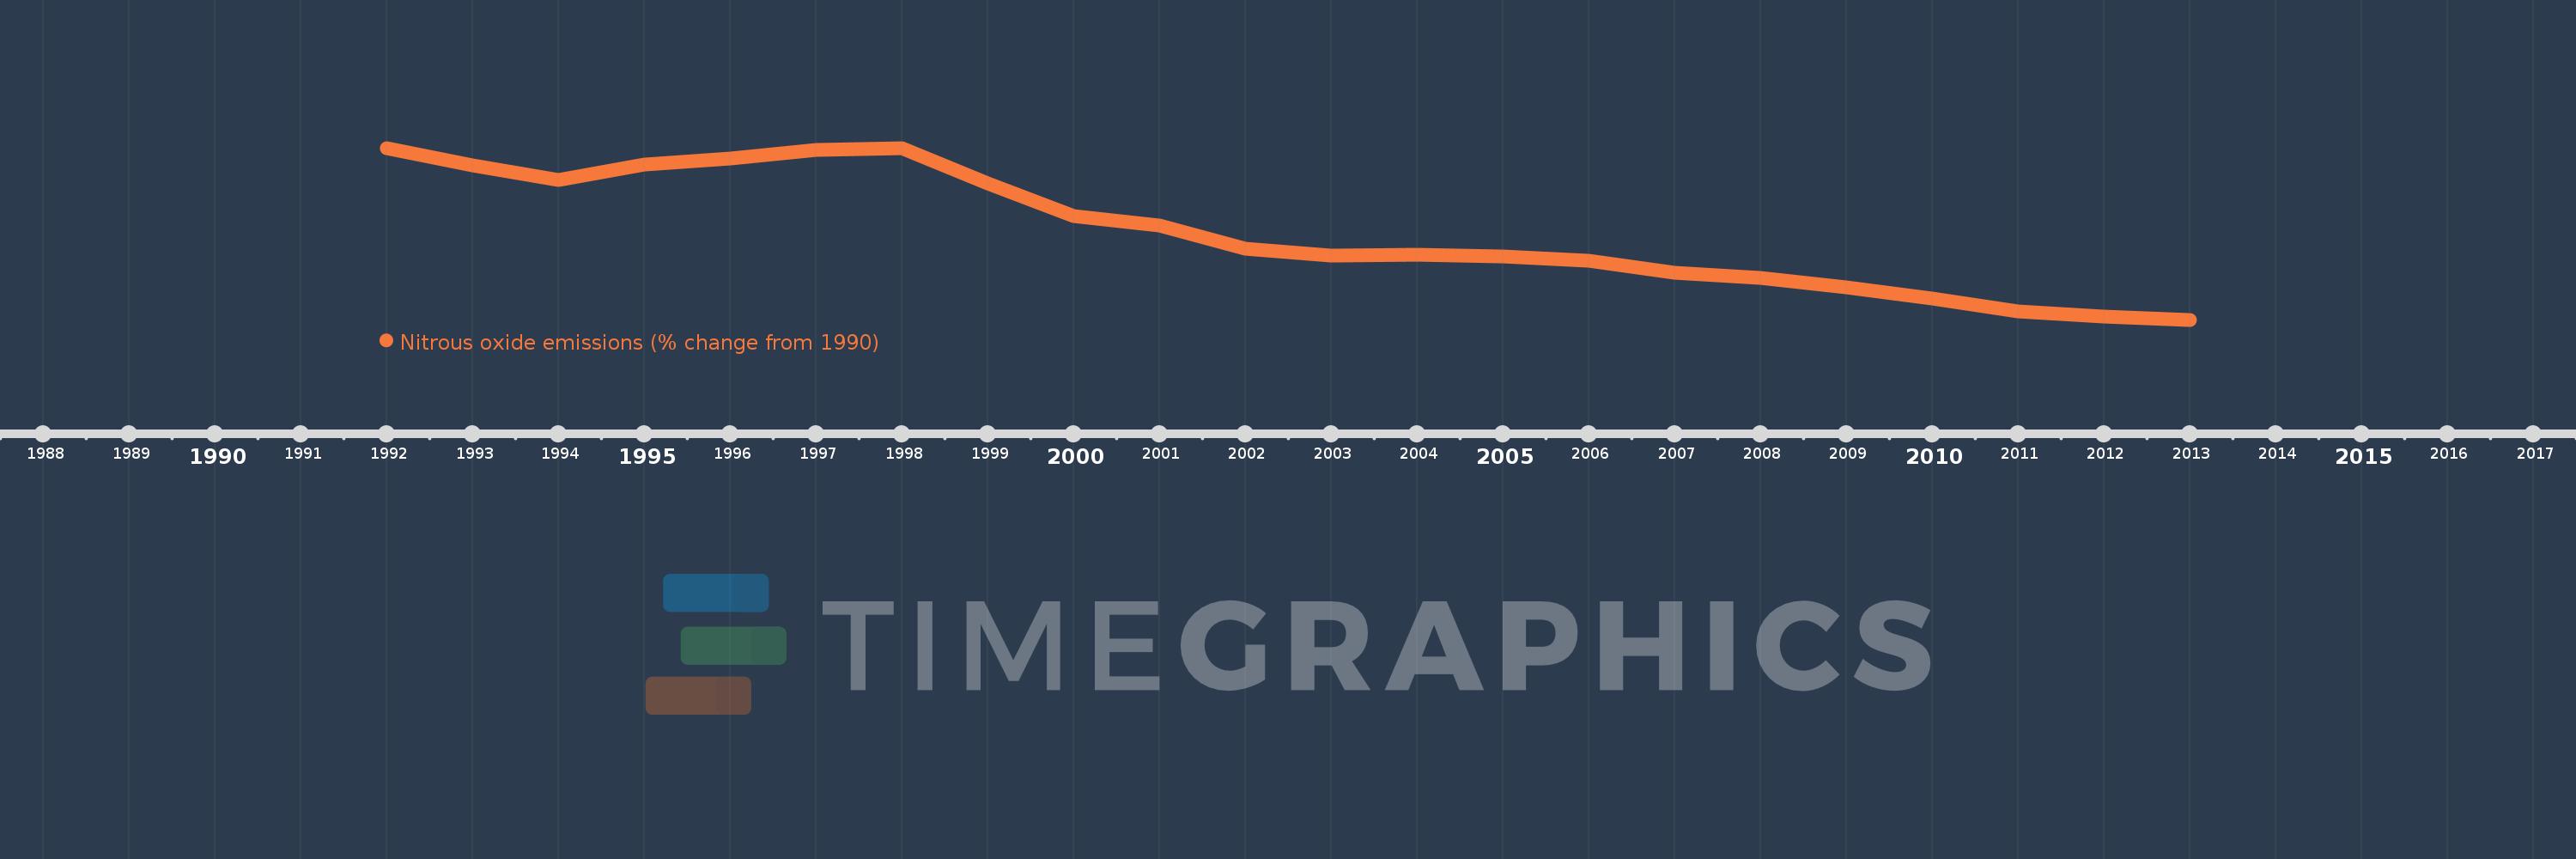
This timeline shows a graph from 1992 to 2013 of European Union. No data until 1991. Number of actual observations by date: 22.
Source name:
World Development Indicators
Source organization:
World Bank staff estimates from original source: European Commission, Joint Research Centre (JRC)/Netherlands Environmental Assessment Agency (PBL). Emission Database for Global Atmospheric Research (EDGAR): http://edgar.jrc.ec.europa.eu/.
Categories, topics:
Climate Change, Environment
Last updated:
apr 23, 2017
Indicators value changes by year
Meaning:
-21.467
Minimum:
-39.785
jan 1, 2013
Maximum:
-4.028
jan 1, 1998
At the date of observation
Value
Absolute change
Change from the previous value
jan 1, 1992
-4.09
-4.09
0.0%
jan 1, 1993
-7.698
-3.608
88.23%
jan 1, 1994
-10.677
-2.979
38.7%
jan 1, 1995
-7.472
+3.205
-30.01%
jan 1, 1996
-6.15
+1.322
-17.69%
jan 1, 1997
-4.442
+1.708
-27.77%
jan 1, 1998
-4.028
+0.415
-9.33%
jan 1, 1999
-11.345
-7.318
181.68%
jan 1, 2000
-18.284
-6.939
61.16%
jan 1, 2001
-20.112
-1.828
10.0%
jan 1, 2002
-25.063
-4.951
24.62%
jan 1, 2003
-26.379
-1.316
5.25%
jan 1, 2004
-26.179
+0.2
-0.76%
jan 1, 2005
-26.623
-0.444
1.69%
jan 1, 2006
-27.505
-0.882
3.31%
jan 1, 2007
-30.079
-2.575
9.36%
jan 1, 2008
-30.996
-0.917
3.05%
jan 1, 2009
-32.983
-1.987
6.41%
jan 1, 2010
-35.294
-2.311
7.01%
jan 1, 2011
-37.992
-2.698
7.65%
jan 1, 2012
-39.104
-1.111
2.93%
jan 1, 2013
-39.785
-0.681
1.74%
Ranking of countries by current statistics by years