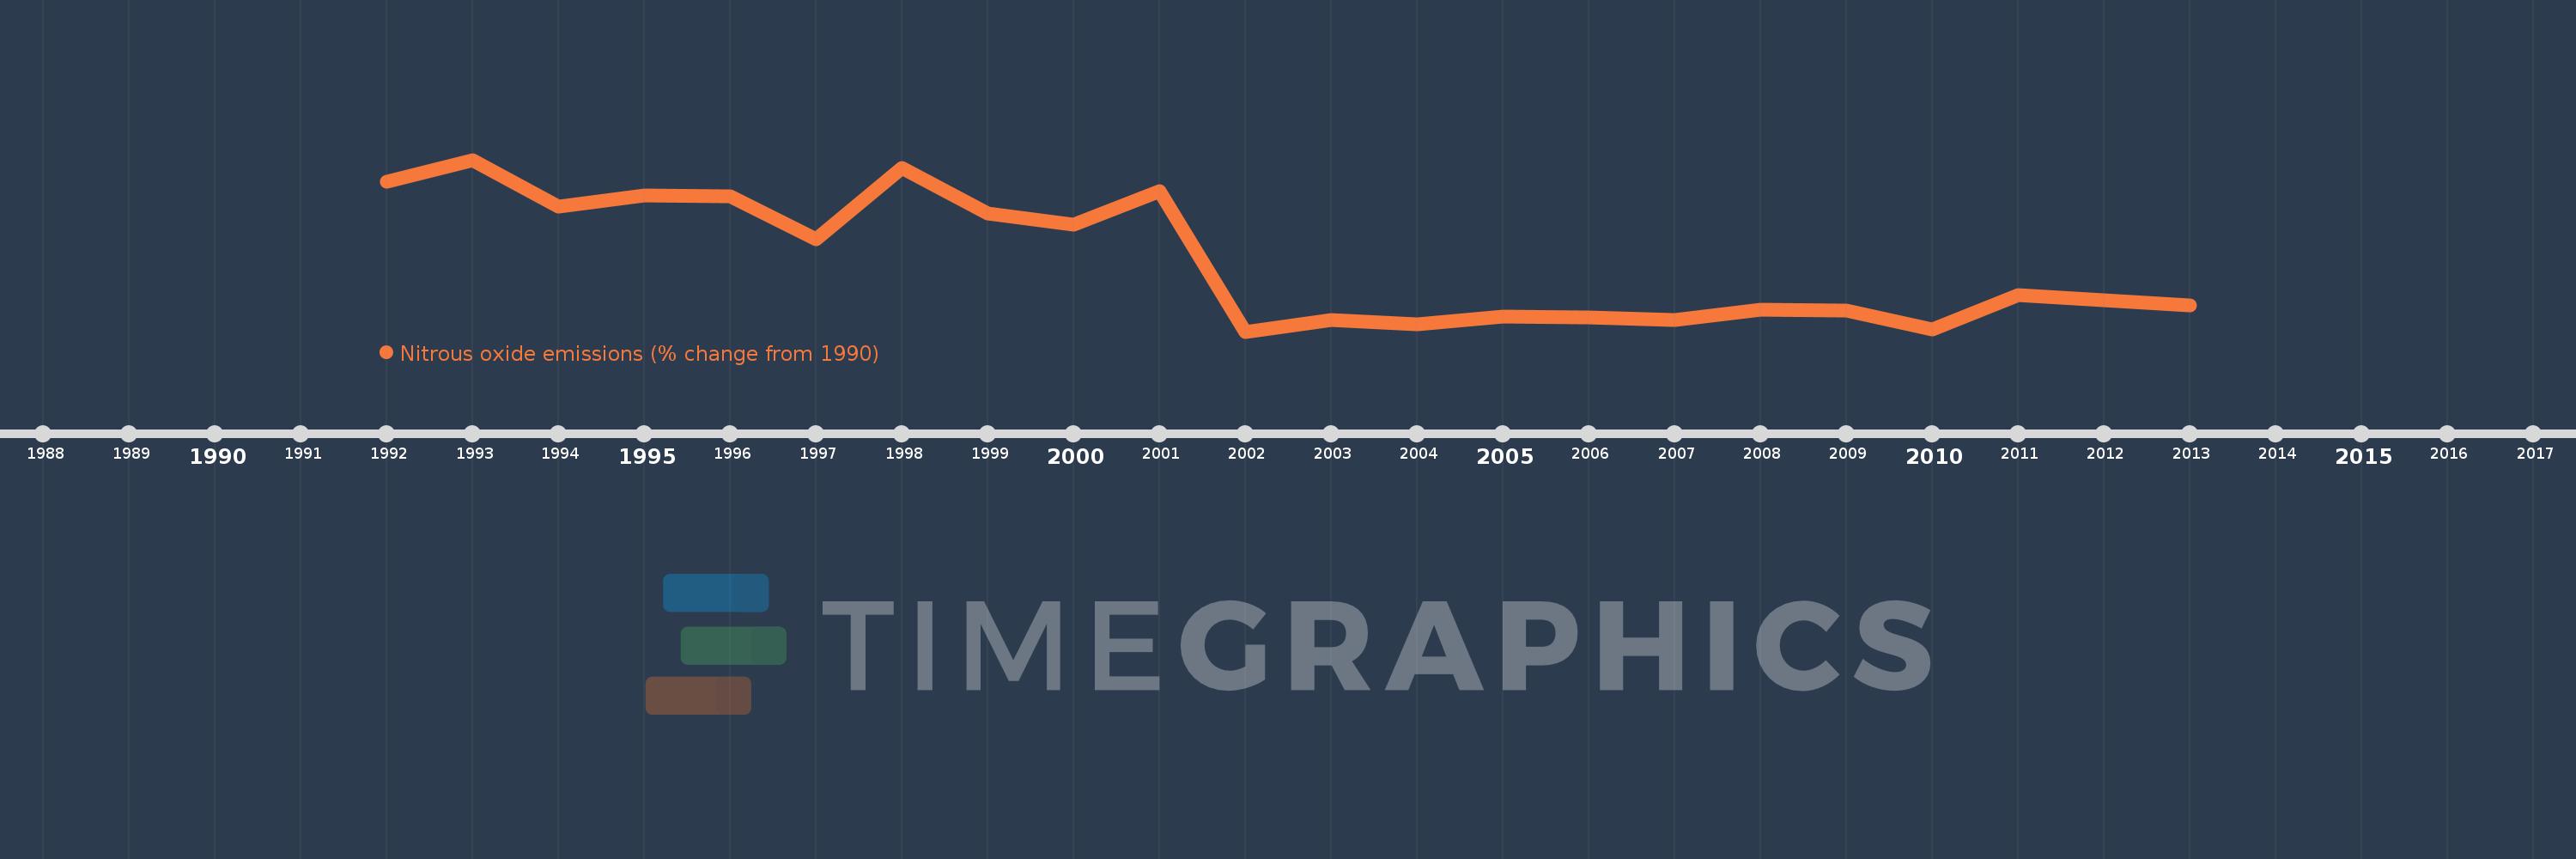
This timeline shows a graph from 1992 to 2013 of Croatia. No data until 1991. Number of actual observations by date: 22.
Source name:
World Development Indicators
Source organization:
World Bank staff estimates from original source: European Commission, Joint Research Centre (JRC)/Netherlands Environmental Assessment Agency (PBL). Emission Database for Global Atmospheric Research (EDGAR): http://edgar.jrc.ec.europa.eu/.
Categories, topics:
Climate Change, Environment
Last updated:
apr 23, 2017
Indicators value changes by year
Meaning:
-32.143
Minimum:
-44.137
jan 1, 2002
Maximum:
-14.666
jan 1, 1993
At the date of observation
Value
Absolute change
Change from the previous value
jan 1, 1992
-18.394
-18.394
0.0%
jan 1, 1993
-14.666
+3.728
-20.27%
jan 1, 1994
-22.769
-8.103
55.25%
jan 1, 1995
-20.733
+2.036
-8.94%
jan 1, 1996
-20.944
-0.211
1.02%
jan 1, 1997
-28.258
-7.313
34.92%
jan 1, 1998
-16.074
+12.184
-43.12%
jan 1, 1999
-23.834
-7.76
48.28%
jan 1, 2000
-25.783
-1.949
8.18%
jan 1, 2001
-20.075
+5.708
-22.14%
jan 1, 2002
-44.137
-24.063
119.87%
jan 1, 2003
-42.133
+2.004
-4.54%
jan 1, 2004
-42.929
-0.796
1.89%
jan 1, 2005
-41.501
+1.428
-3.33%
jan 1, 2006
-41.729
-0.228
0.55%
jan 1, 2007
-42.091
-0.362
0.87%
jan 1, 2008
-40.423
+1.668
-3.96%
jan 1, 2009
-40.575
-0.152
0.38%
jan 1, 2010
-43.802
-3.228
7.96%
jan 1, 2011
-37.824
+5.978
-13.65%
jan 1, 2012
-38.764
-0.94
2.48%
jan 1, 2013
-39.704
-0.94
2.42%
Ranking of countries by current statistics by years