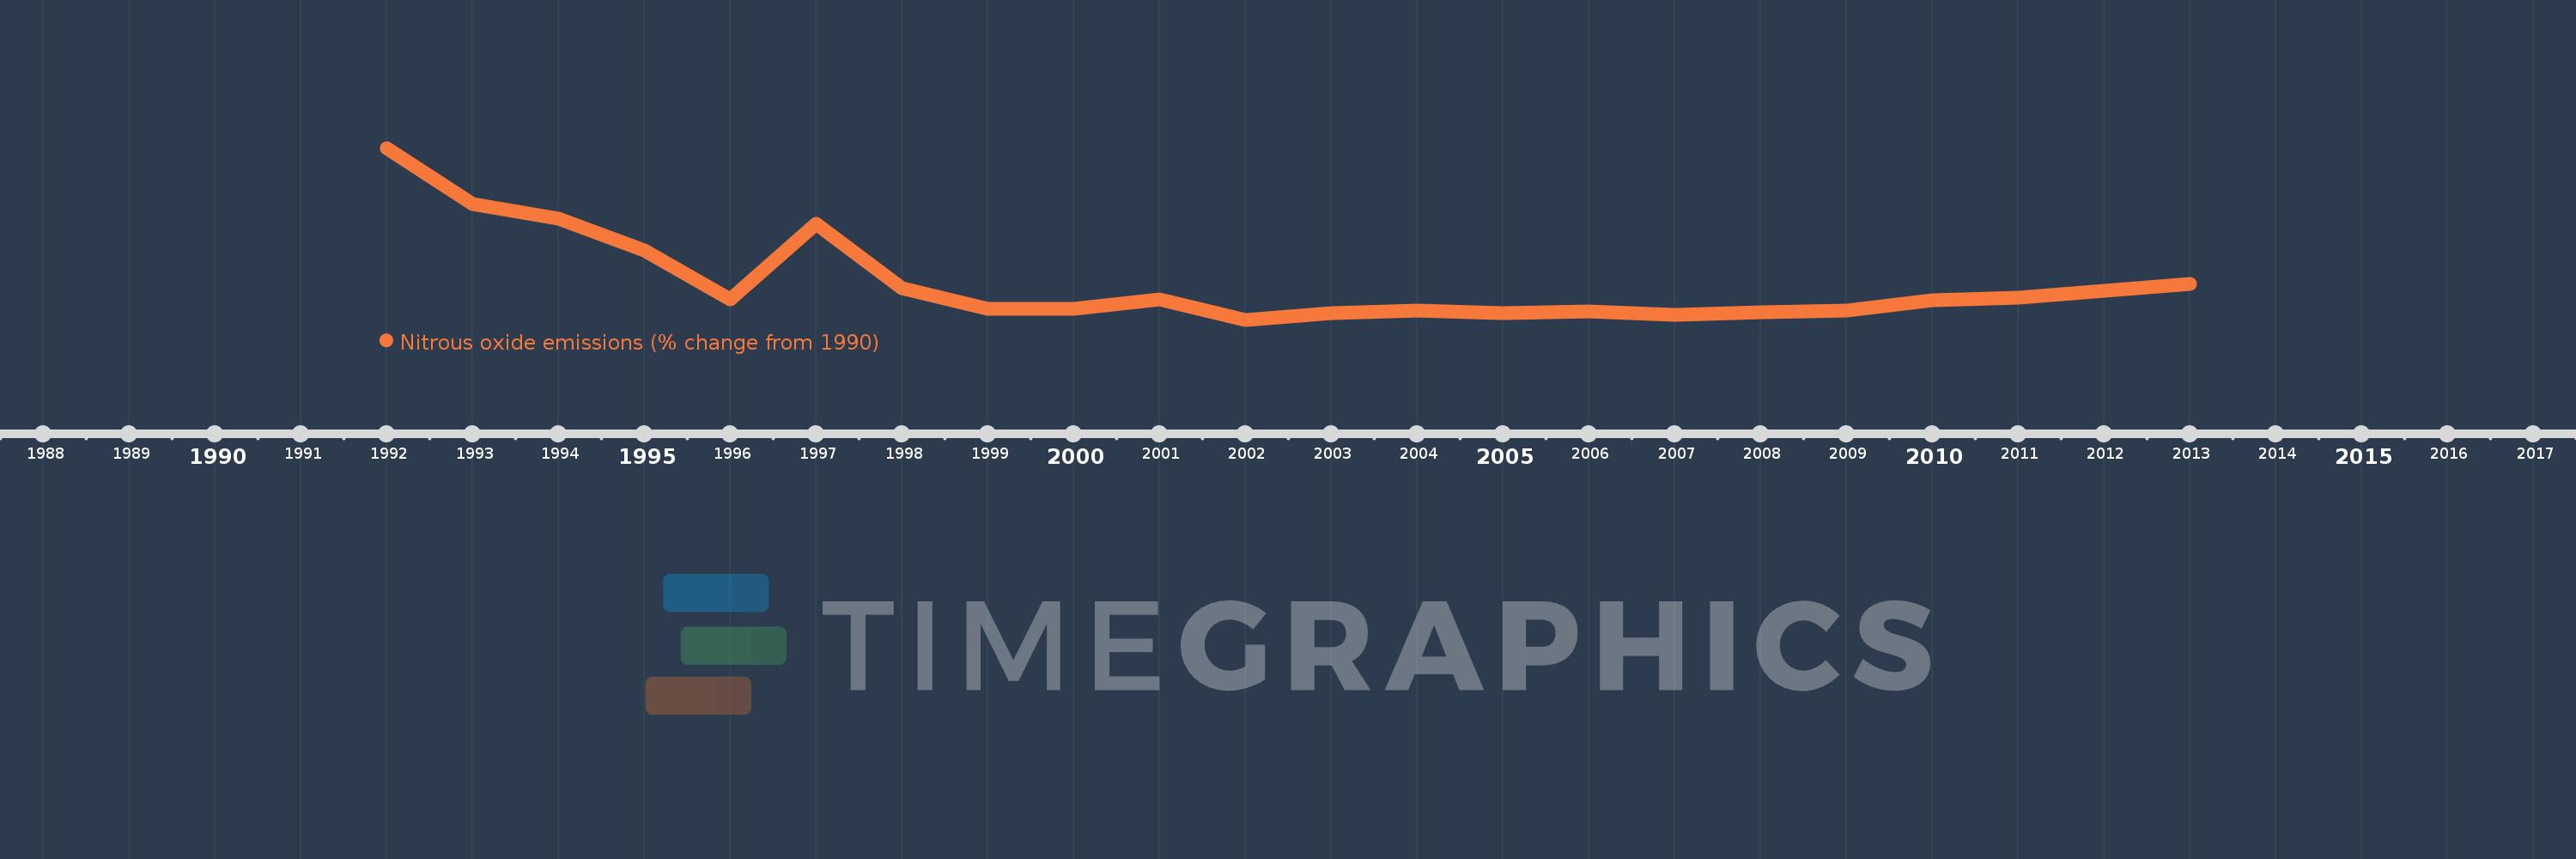
This timeline shows a graph from 1992 to 2013 of Kyrgyz Republic. No data until 1991. Number of actual observations by date: 22.
Source name:
World Development Indicators
Source organization:
World Bank staff estimates from original source: European Commission, Joint Research Centre (JRC)/Netherlands Environmental Assessment Agency (PBL). Emission Database for Global Atmospheric Research (EDGAR): http://edgar.jrc.ec.europa.eu/.
Categories, topics:
Climate Change, Environment
Last updated:
apr 23, 2017
Indicators value changes by year
Meaning:
-45.911
Minimum:
-55.403
jan 1, 2002
Maximum:
-10.949
jan 1, 1992
At the date of observation
Value
Absolute change
Change from the previous value
jan 1, 1992
-10.949
-10.949
0.0%
jan 1, 1993
-25.559
-14.61
133.44%
jan 1, 1994
-29.145
-3.586
14.03%
jan 1, 1995
-37.454
-8.309
28.51%
jan 1, 1996
-50.218
-12.765
34.08%
jan 1, 1997
-30.585
+19.634
-39.1%
jan 1, 1998
-47.294
-16.71
54.63%
jan 1, 1999
-52.582
-5.288
11.18%
jan 1, 2000
-52.569
+0.013
-0.02%
jan 1, 2001
-50.122
+2.447
-4.65%
jan 1, 2002
-55.403
-5.281
10.54%
jan 1, 2003
-53.8
+1.603
-2.89%
jan 1, 2004
-52.972
+0.828
-1.54%
jan 1, 2005
-53.646
-0.675
1.27%
jan 1, 2006
-53.21
+0.436
-0.81%
jan 1, 2007
-54.137
-0.927
1.74%
jan 1, 2008
-53.392
+0.746
-1.38%
jan 1, 2009
-52.942
+0.449
-0.84%
jan 1, 2010
-50.315
+2.627
-4.96%
jan 1, 2011
-49.672
+0.643
-1.28%
jan 1, 2012
-47.918
+1.754
-3.53%
jan 1, 2013
-46.164
+1.754
-3.66%
Ranking of countries by current statistics by years