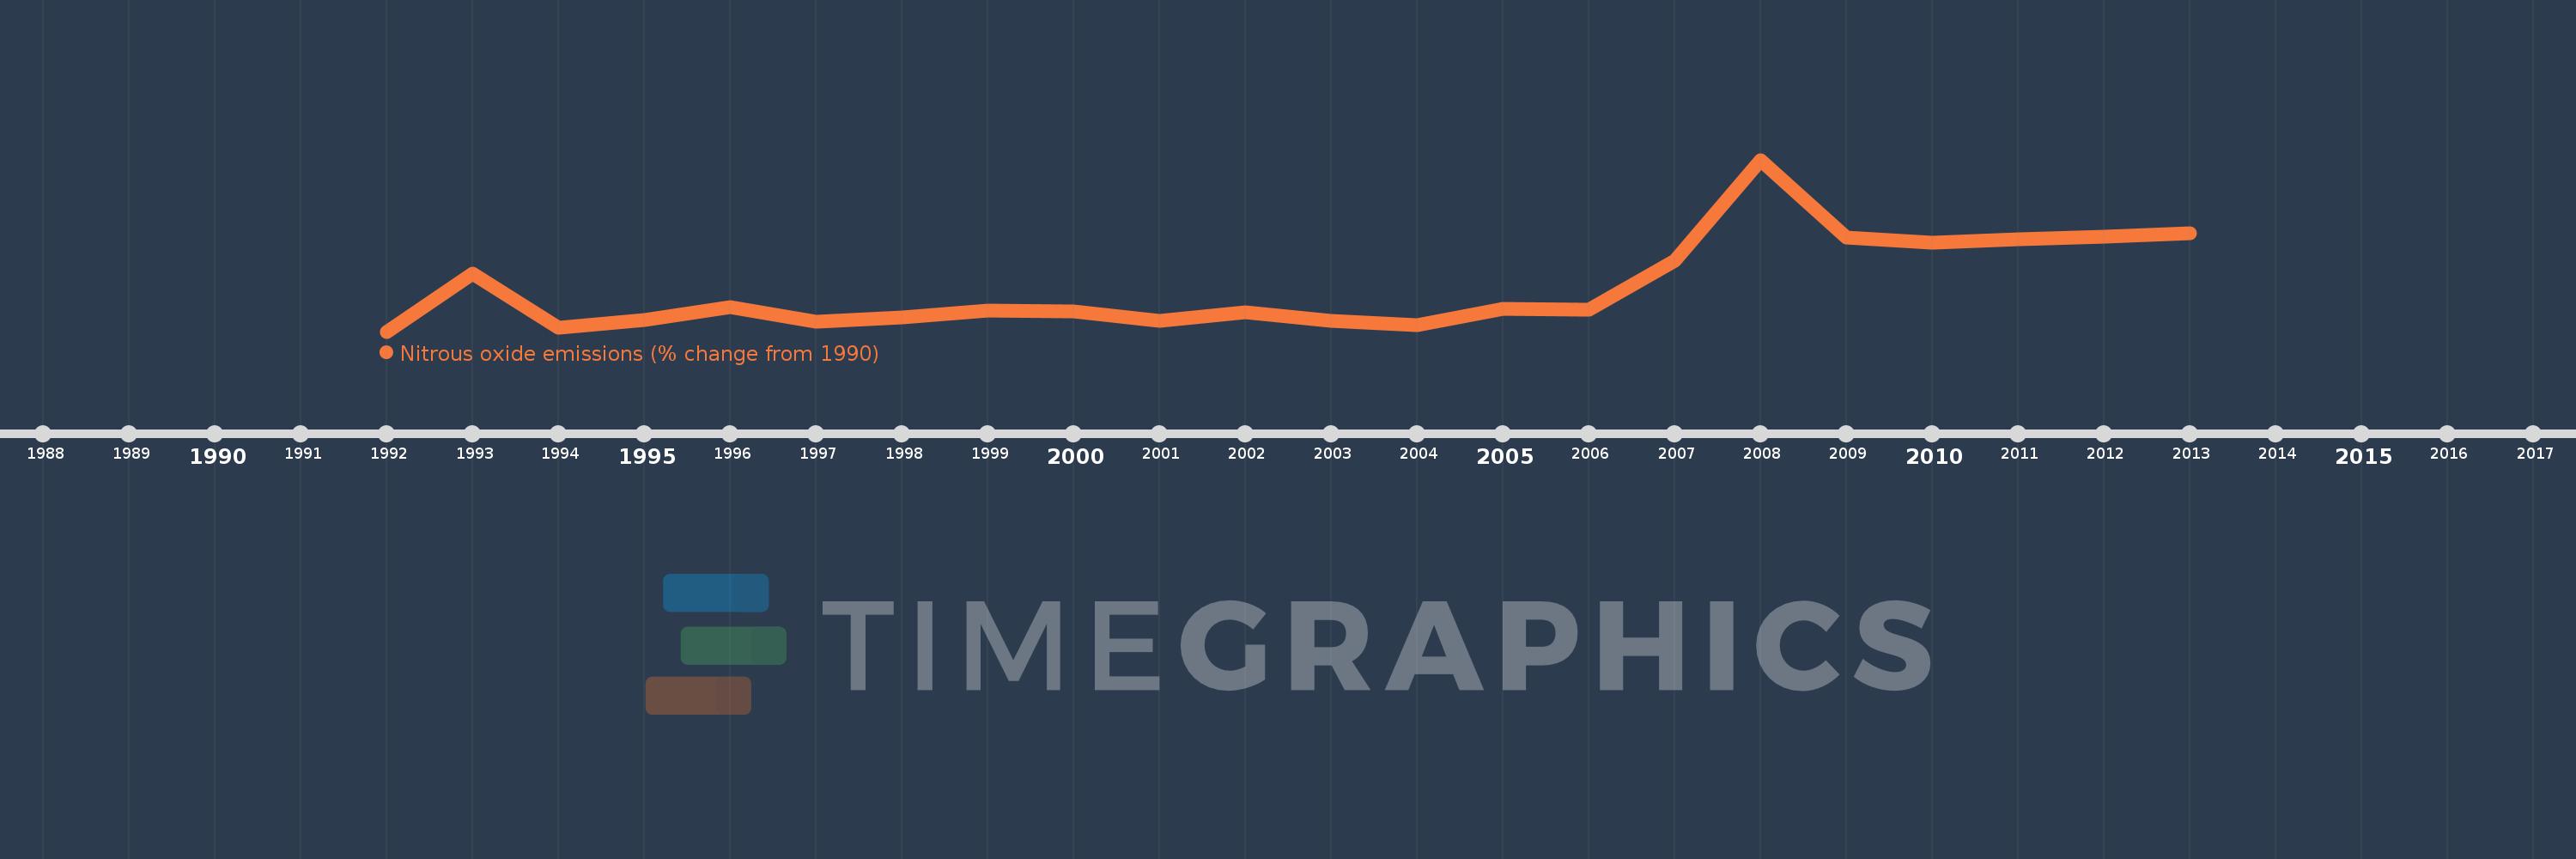
This timeline shows a graph from 1992 to 2013 of IDA total. No data until 1991. Number of actual observations by date: 22.
Source name:
World Development Indicators
Source organization:
World Bank staff estimates from original source: European Commission, Joint Research Centre (JRC)/Netherlands Environmental Assessment Agency (PBL). Emission Database for Global Atmospheric Research (EDGAR): http://edgar.jrc.ec.europa.eu/.
Categories, topics:
Climate Change, Environment
Last updated:
apr 23, 2017
Indicators value changes by year
Meaning:
6.308
Minimum:
-14.053
jan 1, 1992
Maximum:
65.493
jan 1, 2008
At the date of observation
Value
Absolute change
Change from the previous value
jan 1, 1992
-14.053
-14.053
0.0%
jan 1, 1993
12.904
+26.957
-191.83%
jan 1, 1994
-12.278
-25.182
-195.15%
jan 1, 1995
-8.696
+3.582
-29.17%
jan 1, 1996
-2.738
+5.958
-68.52%
jan 1, 1997
-9.334
-6.596
240.89%
jan 1, 1998
-7.427
+1.907
-20.43%
jan 1, 1999
-4.32
+3.106
-41.83%
jan 1, 2000
-4.726
-0.406
9.39%
jan 1, 2001
-9.177
-4.451
94.18%
jan 1, 2002
-4.944
+4.233
-46.13%
jan 1, 2003
-9.059
-4.115
83.23%
jan 1, 2004
-10.982
-1.923
21.22%
jan 1, 2005
-3.541
+7.441
-67.76%
jan 1, 2006
-3.976
-0.435
12.28%
jan 1, 2007
18.819
+22.794
-573.32%
jan 1, 2008
65.493
+46.674
248.02%
jan 1, 2009
29.476
-36.017
-54.99%
jan 1, 2010
27.137
-2.339
-7.93%
jan 1, 2011
28.675
+1.537
5.67%
jan 1, 2012
30.069
+1.394
4.86%
jan 1, 2013
31.462
+1.394
4.64%
Ranking of countries by current statistics by years