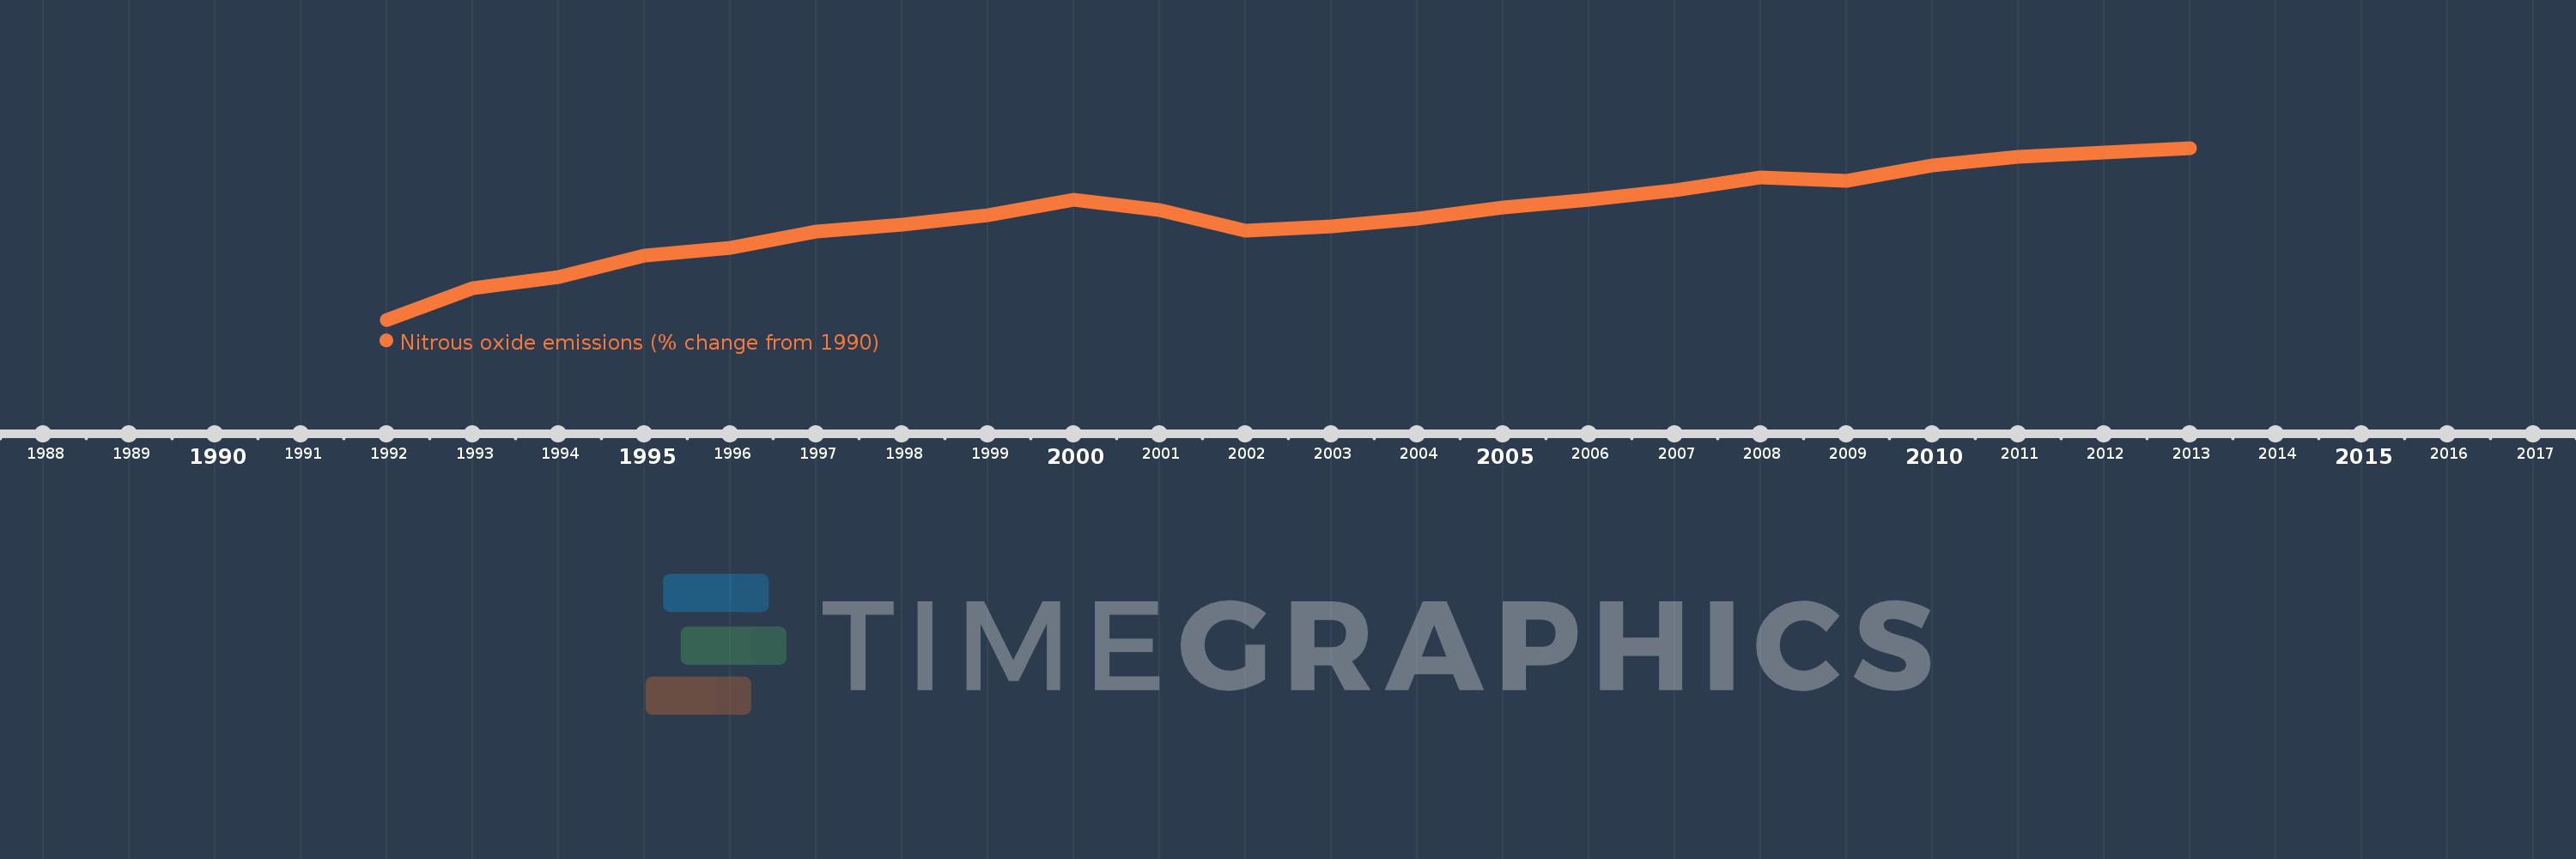
This timeline shows a graph from 1992 to 2013 of Pakistan. No data until 1991. Number of actual observations by date: 22.
Source name:
World Development Indicators
Source organization:
World Bank staff estimates from original source: European Commission, Joint Research Centre (JRC)/Netherlands Environmental Assessment Agency (PBL). Emission Database for Global Atmospheric Research (EDGAR): http://edgar.jrc.ec.europa.eu/.
Categories, topics:
Climate Change, Environment
Last updated:
apr 23, 2017
Indicators value changes by year
Meaning:
41.053
Minimum:
1.507
jan 1, 1992
Maximum:
66.189
jan 1, 2013
At the date of observation
Value
Absolute change
Change from the previous value
jan 1, 1992
1.507
+1.507
0.0%
jan 1, 1993
13.385
+11.878
788.46%
jan 1, 1994
17.464
+4.079
30.48%
jan 1, 1995
25.685
+8.221
47.07%
jan 1, 1996
28.64
+2.955
11.51%
jan 1, 1997
34.66
+6.02
21.02%
jan 1, 1998
37.277
+2.617
7.55%
jan 1, 1999
40.739
+3.462
9.29%
jan 1, 2000
46.565
+5.826
14.3%
jan 1, 2001
42.868
-3.696
-7.94%
jan 1, 2002
35.022
-7.847
-18.3%
jan 1, 2003
36.706
+1.684
4.81%
jan 1, 2004
39.679
+2.973
8.1%
jan 1, 2005
43.846
+4.167
10.5%
jan 1, 2006
46.812
+2.966
6.77%
jan 1, 2007
50.182
+3.37
7.2%
jan 1, 2008
54.948
+4.765
9.5%
jan 1, 2009
53.838
-1.11
-2.02%
jan 1, 2010
59.658
+5.821
10.81%
jan 1, 2011
62.931
+3.273
5.49%
jan 1, 2012
64.56
+1.629
2.59%
jan 1, 2013
66.189
+1.629
2.52%
Ranking of countries by current statistics by years