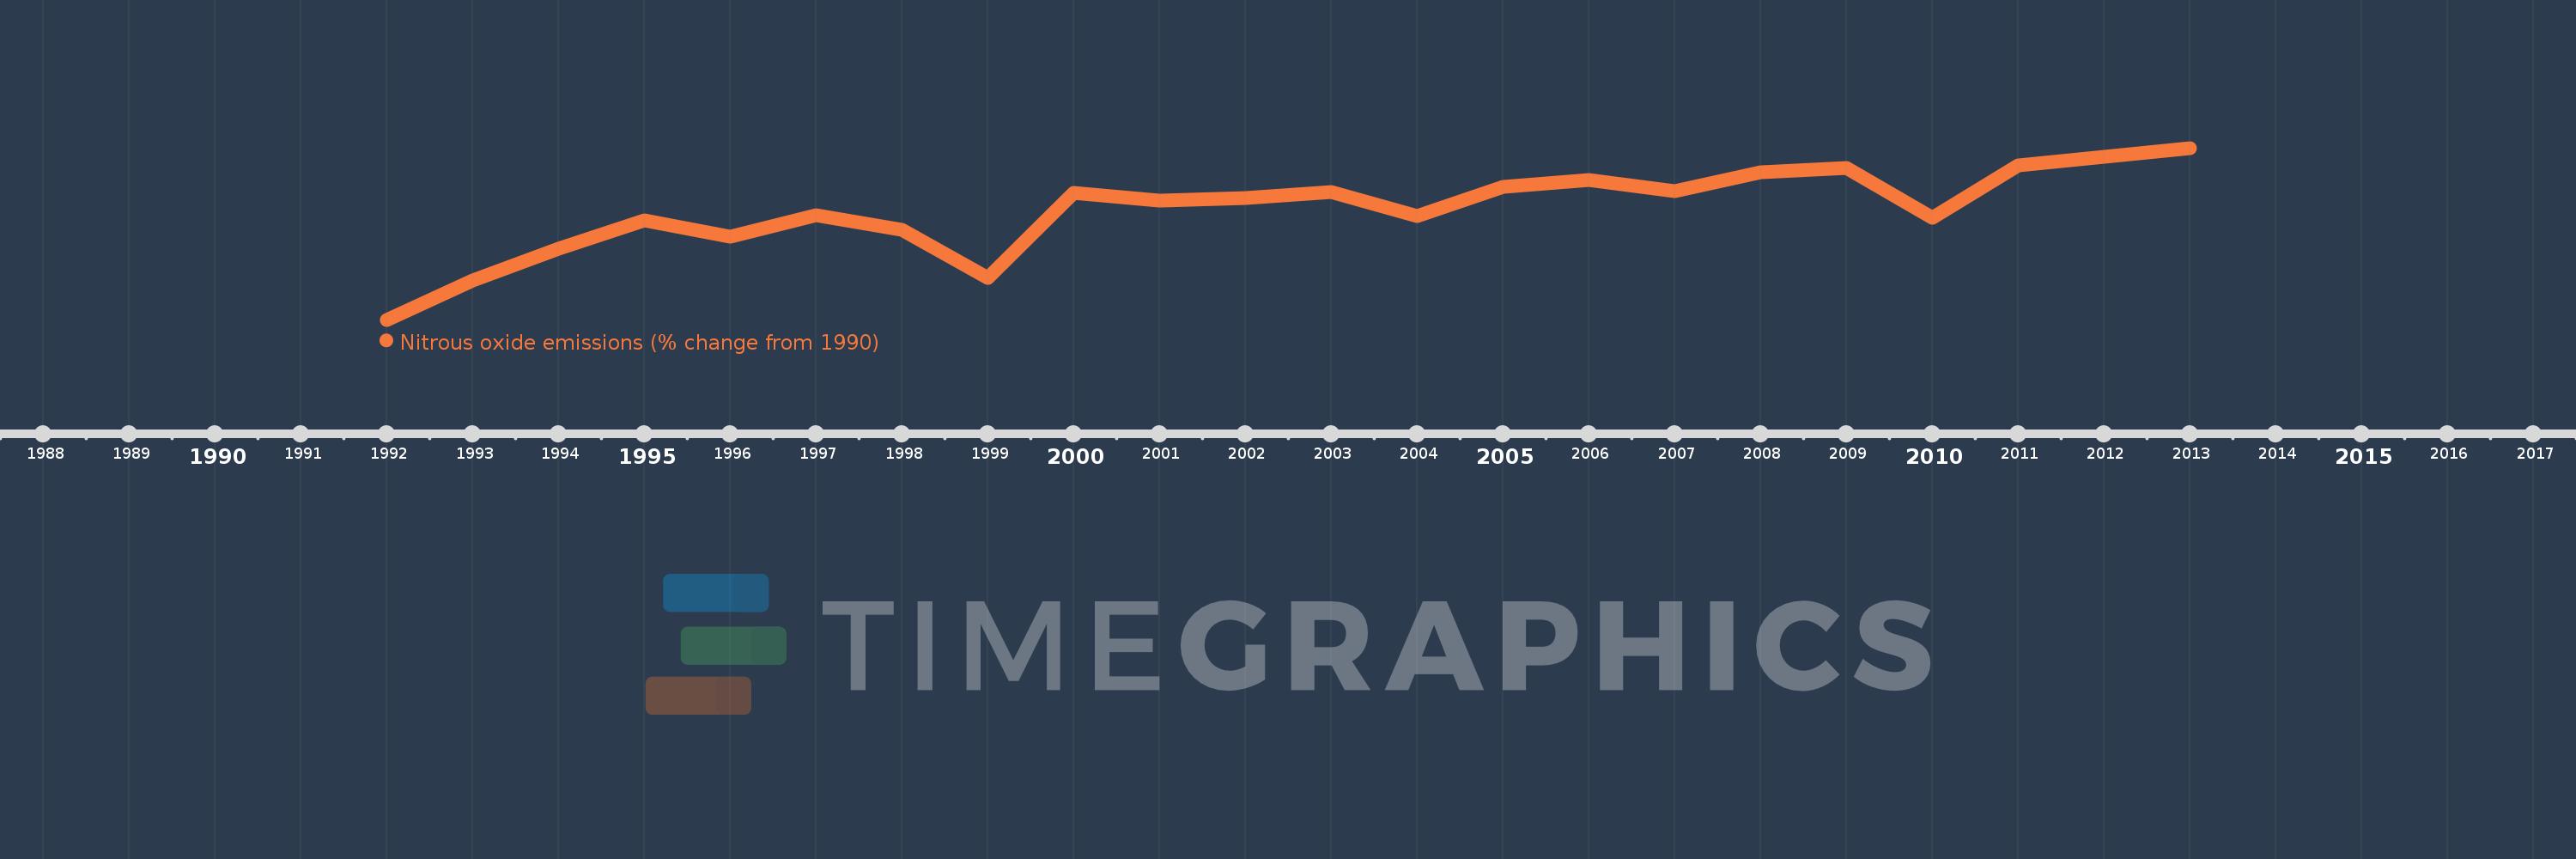
This timeline shows a graph from 1992 to 2013 of Sri Lanka. No data until 1991. Number of actual observations by date: 22.
Source name:
World Development Indicators
Source organization:
World Bank staff estimates from original source: European Commission, Joint Research Centre (JRC)/Netherlands Environmental Assessment Agency (PBL). Emission Database for Global Atmospheric Research (EDGAR): http://edgar.jrc.ec.europa.eu/.
Categories, topics:
Climate Change, Environment
Last updated:
apr 23, 2017
Indicators value changes by year
Meaning:
14.854
Minimum:
-0.684
jan 1, 1992
Maximum:
23.576
jan 1, 2013
At the date of observation
Value
Absolute change
Change from the previous value
jan 1, 1992
-0.684
-0.684
0.0%
jan 1, 1993
4.84
+5.524
-807.47%
jan 1, 1994
9.386
+4.546
93.92%
jan 1, 1995
13.363
+3.977
42.37%
jan 1, 1996
11.032
-2.331
-17.44%
jan 1, 1997
14.019
+2.987
27.08%
jan 1, 1998
12.031
-1.989
-14.19%
jan 1, 1999
5.184
-6.846
-56.91%
jan 1, 2000
17.236
+12.052
232.48%
jan 1, 2001
16.2
-1.036
-6.01%
jan 1, 2002
16.482
+0.282
1.74%
jan 1, 2003
17.41
+0.928
5.63%
jan 1, 2004
13.903
-3.507
-20.14%
jan 1, 2005
18.099
+4.196
30.18%
jan 1, 2006
19.02
+0.92
5.09%
jan 1, 2007
17.504
-1.516
-7.97%
jan 1, 2008
20.164
+2.661
15.2%
jan 1, 2009
20.798
+0.634
3.14%
jan 1, 2010
13.699
-7.099
-34.13%
jan 1, 2011
21.153
+7.454
54.41%
jan 1, 2012
22.365
+1.212
5.73%
jan 1, 2013
23.576
+1.212
5.42%
Ranking of countries by current statistics by years