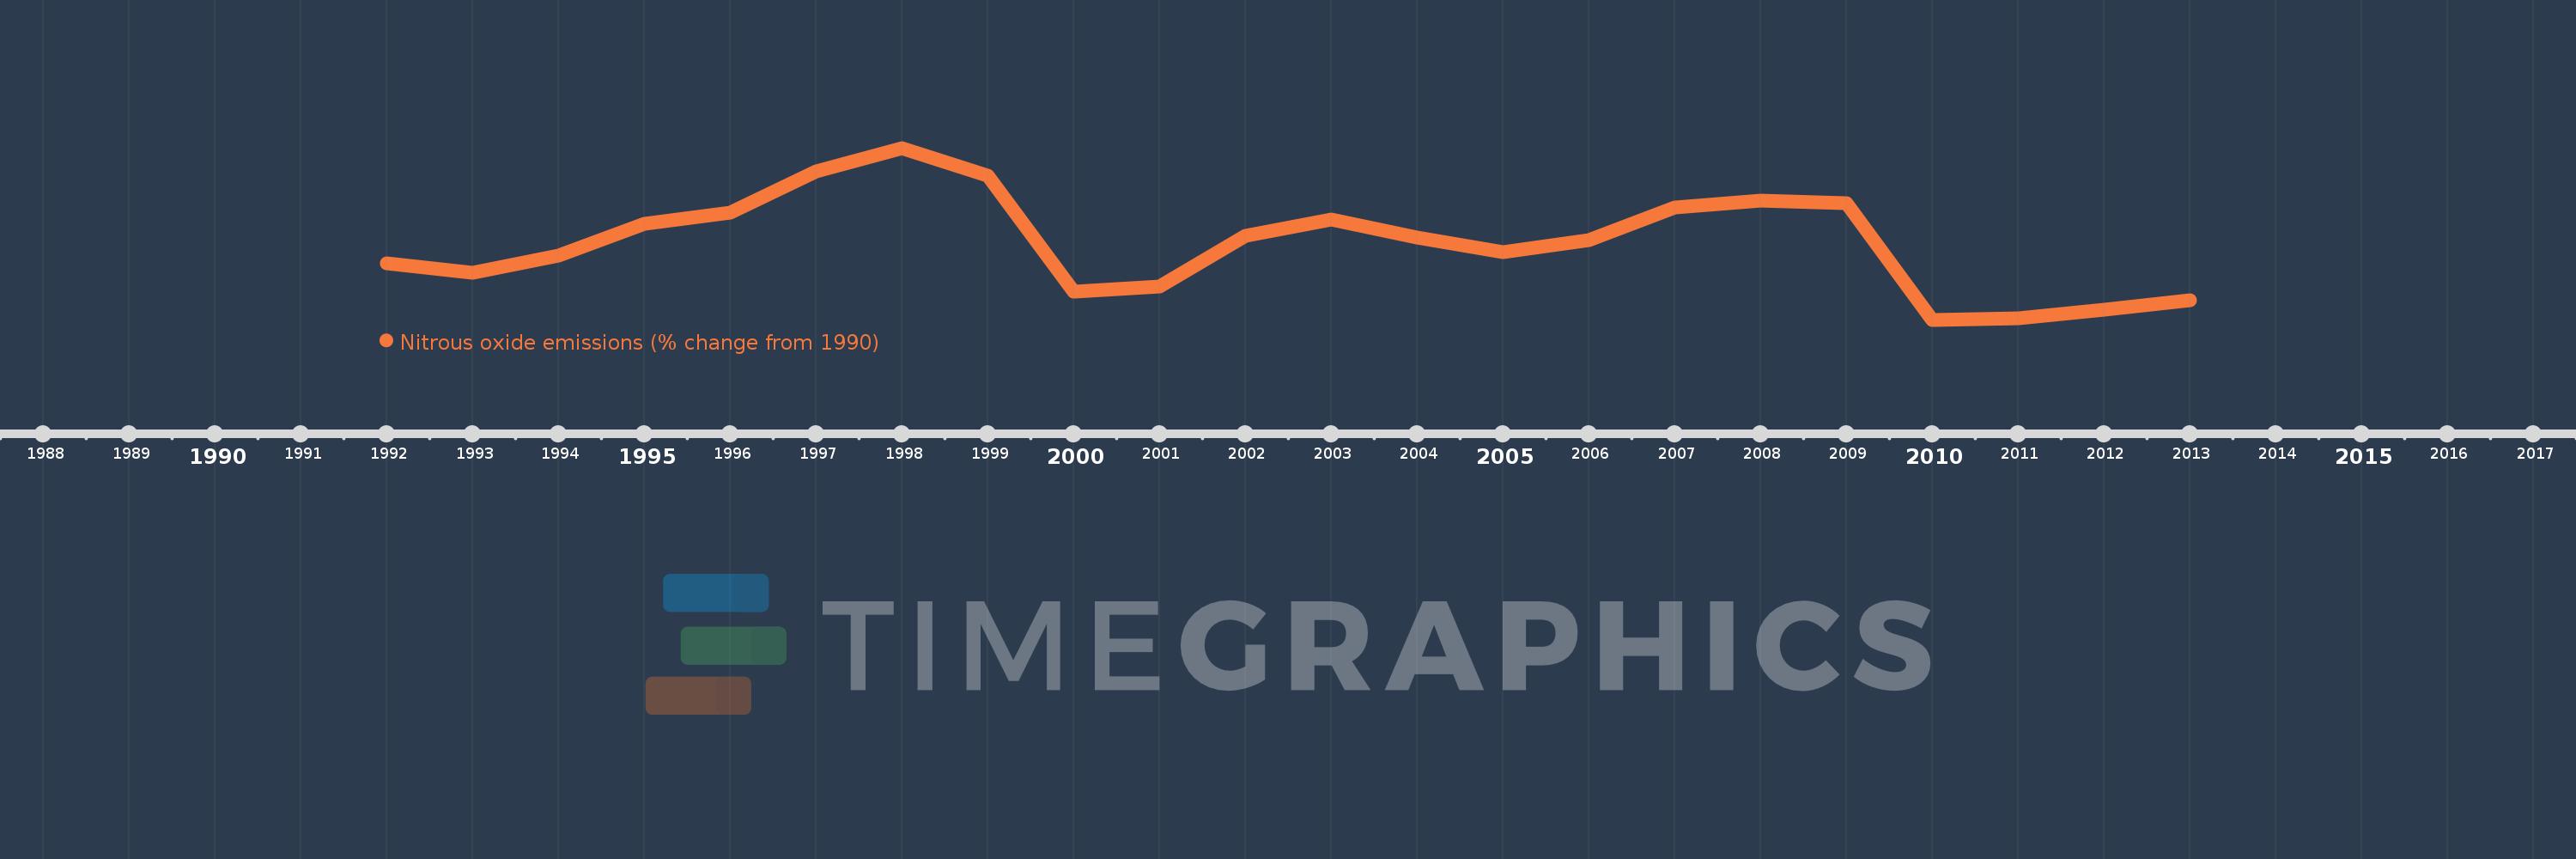
This timeline shows a graph from 1992 to 2013 of Dominican Republic. No data until 1991. Number of actual observations by date: 22.
Source name:
World Development Indicators
Source organization:
World Bank staff estimates from original source: European Commission, Joint Research Centre (JRC)/Netherlands Environmental Assessment Agency (PBL). Emission Database for Global Atmospheric Research (EDGAR): http://edgar.jrc.ec.europa.eu/.
Categories, topics:
Climate Change, Environment
Last updated:
apr 23, 2017
Indicators value changes by year
Meaning:
9.181
Minimum:
0.688
jan 1, 2010
Maximum:
19.702
jan 1, 1998
At the date of observation
Value
Absolute change
Change from the previous value
jan 1, 1992
6.949
+6.949
0.0%
jan 1, 1993
5.846
-1.102
-15.86%
jan 1, 1994
7.786
+1.939
33.17%
jan 1, 1995
11.354
+3.568
45.83%
jan 1, 1996
12.569
+1.215
10.7%
jan 1, 1997
17.097
+4.528
36.03%
jan 1, 1998
19.702
+2.605
15.24%
jan 1, 1999
16.604
-3.098
-15.73%
jan 1, 2000
3.772
-12.832
-77.28%
jan 1, 2001
4.354
+0.583
15.45%
jan 1, 2002
10.005
+5.651
129.76%
jan 1, 2003
11.827
+1.822
18.21%
jan 1, 2004
9.769
-2.057
-17.39%
jan 1, 2005
8.142
-1.628
-16.66%
jan 1, 2006
9.465
+1.323
16.25%
jan 1, 2007
13.12
+3.655
38.62%
jan 1, 2008
13.834
+0.714
5.44%
jan 1, 2009
13.596
-0.238
-1.72%
jan 1, 2010
0.688
-12.908
-94.94%
jan 1, 2011
0.824
+0.136
19.81%
jan 1, 2012
1.832
+1.008
122.39%
jan 1, 2013
2.84
+1.008
55.03%
Ranking of countries by current statistics by years