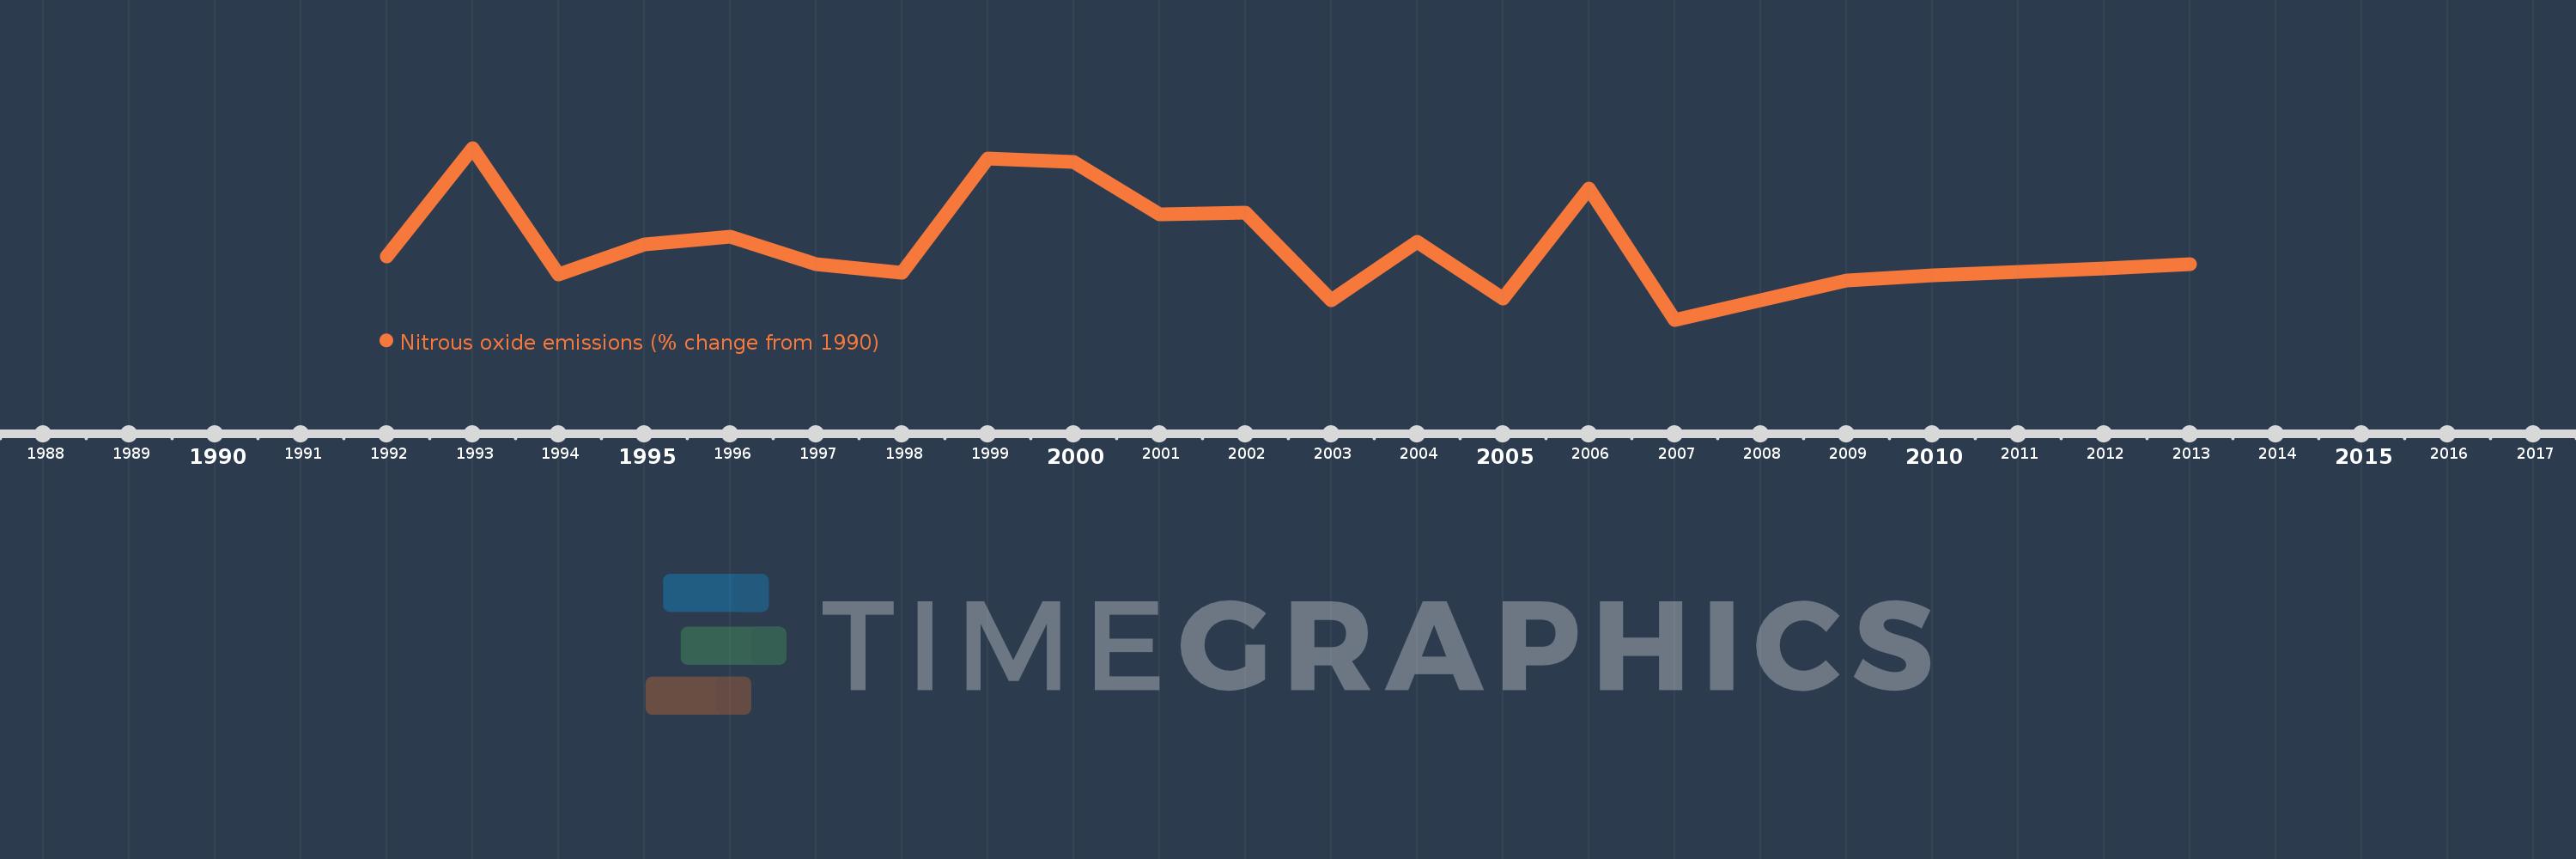
This timeline shows a graph from 1992 to 2013 of Madagascar. No data until 1991. Number of actual observations by date: 22.
Source name:
World Development Indicators
Source organization:
World Bank staff estimates from original source: European Commission, Joint Research Centre (JRC)/Netherlands Environmental Assessment Agency (PBL). Emission Database for Global Atmospheric Research (EDGAR): http://edgar.jrc.ec.europa.eu/.
Categories, topics:
Climate Change, Environment
Last updated:
apr 23, 2017
Indicators value changes by year
Meaning:
-6.176
Minimum:
-21.987
jan 1, 2007
Maximum:
15.808
jan 1, 1993
At the date of observation
Value
Absolute change
Change from the previous value
jan 1, 1992
-8.115
-8.115
0.0%
jan 1, 1993
15.808
+23.923
-294.8%
jan 1, 1994
-11.952
-27.76
-175.61%
jan 1, 1995
-5.349
+6.604
-55.25%
jan 1, 1996
-3.664
+1.684
-31.49%
jan 1, 1997
-9.683
-6.019
164.24%
jan 1, 1998
-11.728
-2.045
21.12%
jan 1, 1999
13.525
+25.252
-215.32%
jan 1, 2000
12.681
-0.843
-6.24%
jan 1, 2001
1.246
-11.435
-90.18%
jan 1, 2002
1.671
+0.425
34.12%
jan 1, 2003
-17.724
-19.395
-1.16K%
jan 1, 2004
-4.825
+12.899
-72.78%
jan 1, 2005
-17.306
-12.481
258.67%
jan 1, 2006
6.892
+24.197
-139.82%
jan 1, 2007
-21.987
-28.878
-419.04%
jan 1, 2008
-17.685
+4.302
-19.56%
jan 1, 2009
-13.374
+4.311
-24.38%
jan 1, 2010
-12.301
+1.073
-8.02%
jan 1, 2011
-11.551
+0.75
-6.1%
jan 1, 2012
-10.666
+0.884
-7.66%
jan 1, 2013
-9.782
+0.884
-8.29%
Ranking of countries by current statistics by years