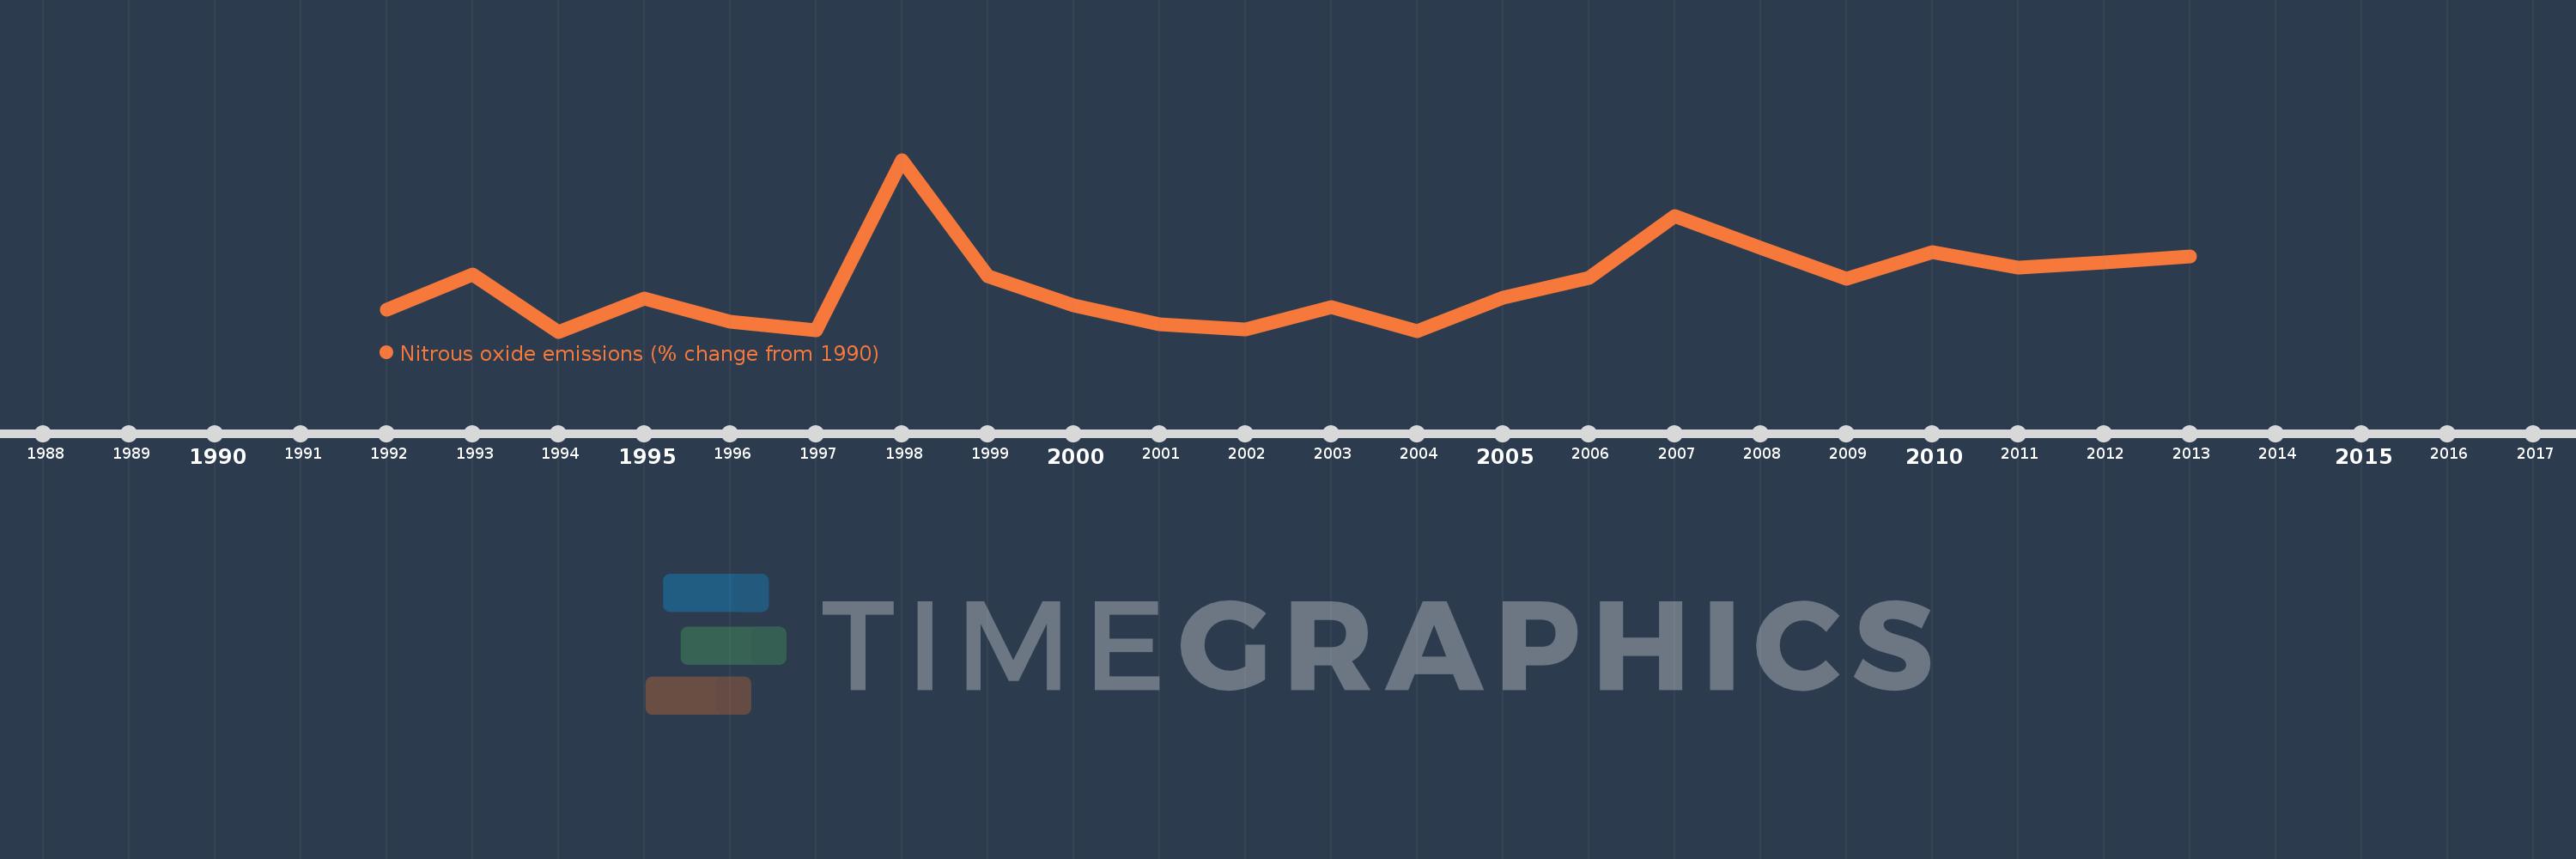
This timeline shows a graph from 1992 to 2013 of Lower middle income. No data until 1991. Number of actual observations by date: 22.
Source name:
World Development Indicators
Source organization:
World Bank staff estimates from original source: European Commission, Joint Research Centre (JRC)/Netherlands Environmental Assessment Agency (PBL). Emission Database for Global Atmospheric Research (EDGAR): http://edgar.jrc.ec.europa.eu/.
Categories, topics:
Climate Change, Environment
Last updated:
apr 23, 2017
Indicators value changes by year
Meaning:
13.846
Minimum:
1.419
jan 1, 1994
Maximum:
46.702
jan 1, 1998
At the date of observation
Value
Absolute change
Change from the previous value
jan 1, 1992
7.22
+7.22
0.0%
jan 1, 1993
16.42
+9.2
127.43%
jan 1, 1994
1.419
-15.002
-91.36%
jan 1, 1995
10.126
+8.707
613.72%
jan 1, 1996
4.084
-6.042
-59.67%
jan 1, 1997
1.842
-2.241
-54.89%
jan 1, 1998
46.702
+44.86
2.44K%
jan 1, 1999
15.913
-30.789
-65.93%
jan 1, 2000
8.4
-7.512
-47.21%
jan 1, 2001
3.25
-5.151
-61.31%
jan 1, 2002
1.891
-1.359
-41.82%
jan 1, 2003
7.843
+5.952
314.81%
jan 1, 2004
1.645
-6.199
-79.03%
jan 1, 2005
10.365
+8.72
530.19%
jan 1, 2006
15.513
+5.148
49.67%
jan 1, 2007
31.841
+16.329
105.26%
jan 1, 2008
23.455
-8.386
-26.34%
jan 1, 2009
15.274
-8.181
-34.88%
jan 1, 2010
22.298
+7.024
45.99%
jan 1, 2011
18.242
-4.056
-18.19%
jan 1, 2012
19.706
+1.464
8.02%
jan 1, 2013
21.17
+1.464
7.43%
Ranking of countries by current statistics by years