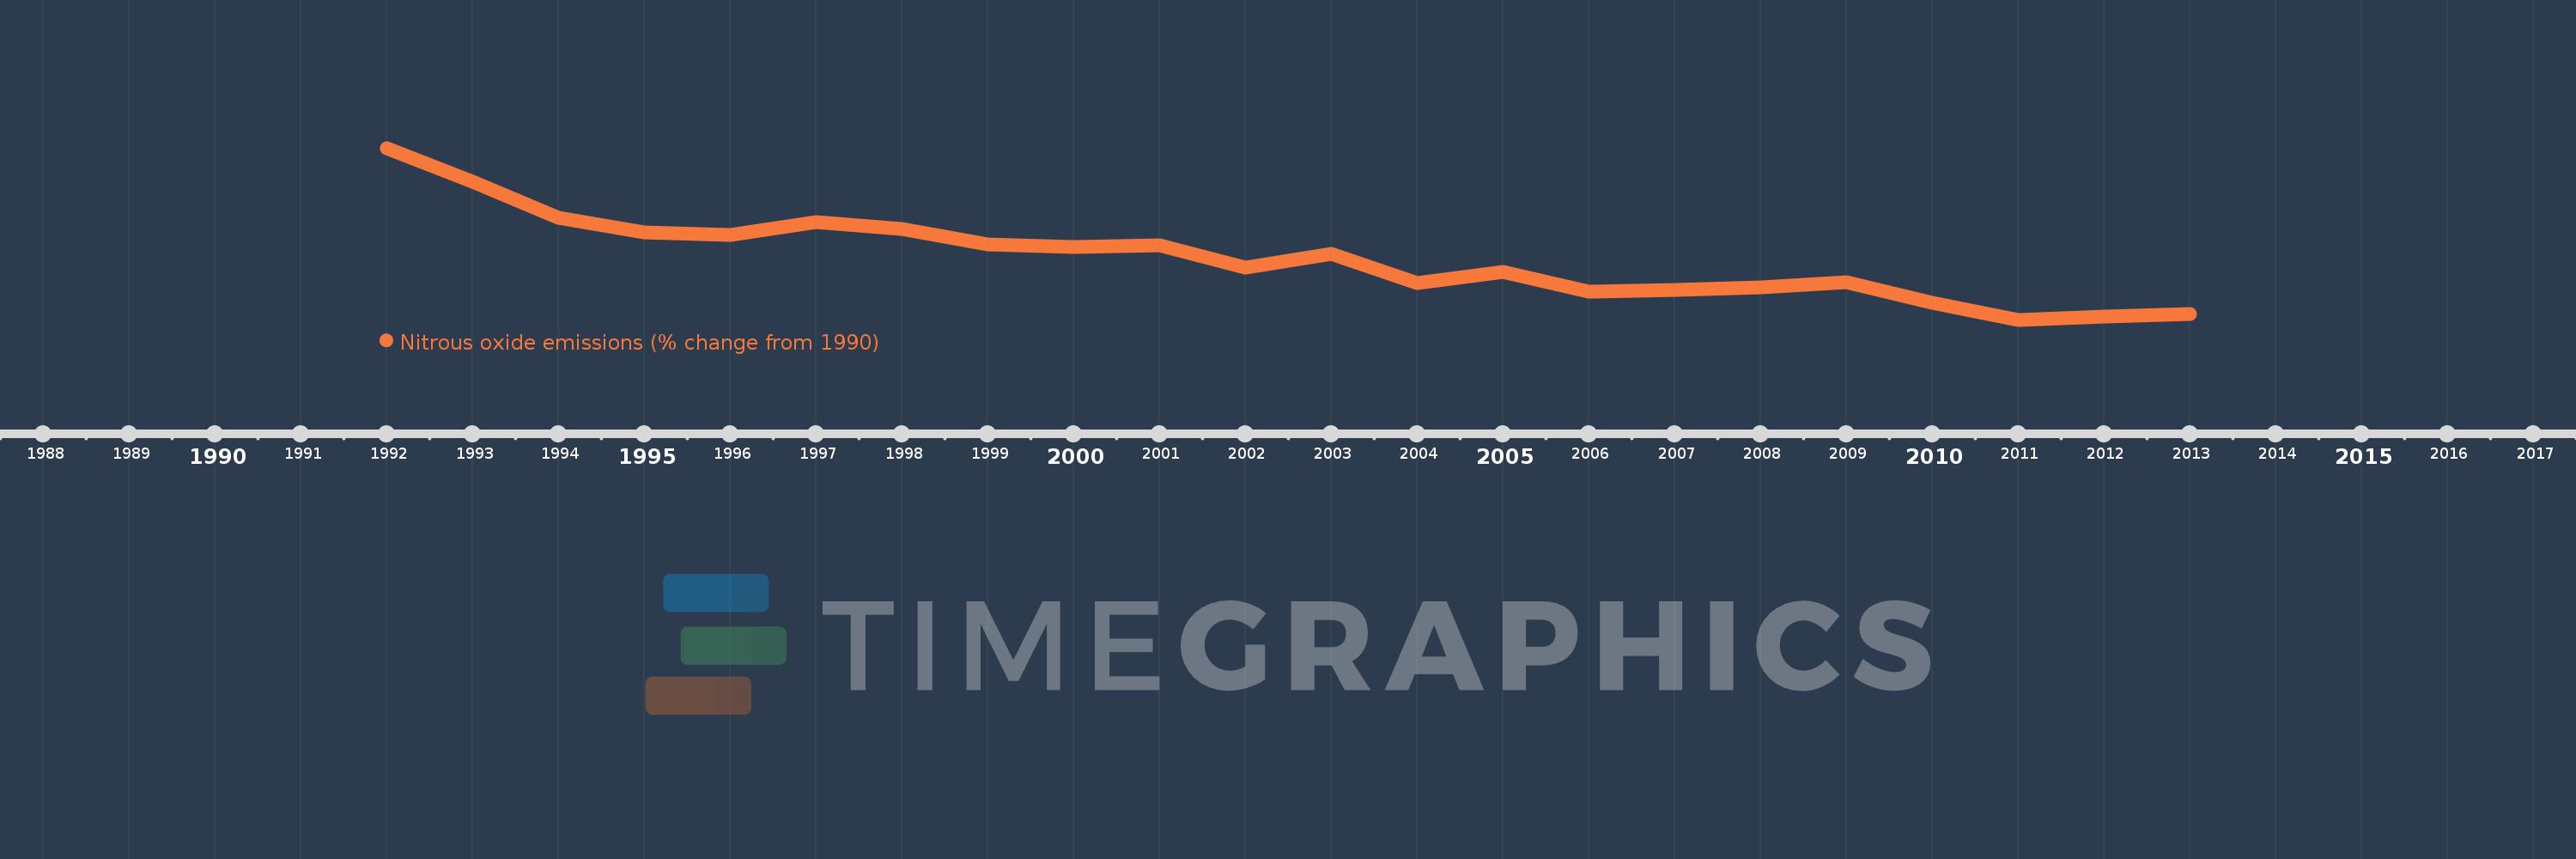
This timeline shows a graph from 1992 to 2013 of Cuba. No data until 1991. Number of actual observations by date: 22.
Source name:
World Development Indicators
Source organization:
World Bank staff estimates from original source: European Commission, Joint Research Centre (JRC)/Netherlands Environmental Assessment Agency (PBL). Emission Database for Global Atmospheric Research (EDGAR): http://edgar.jrc.ec.europa.eu/.
Categories, topics:
Climate Change, Environment
Last updated:
apr 23, 2017
Indicators value changes by year
Meaning:
-27.273
Minimum:
-40.28
jan 1, 2011
Maximum:
-3.864
jan 1, 1992
At the date of observation
Value
Absolute change
Change from the previous value
jan 1, 1992
-3.864
-3.864
0.0%
jan 1, 1993
-10.946
-7.083
183.32%
jan 1, 1994
-18.702
-7.756
70.85%
jan 1, 1995
-21.765
-3.063
16.38%
jan 1, 1996
-22.396
-0.631
2.9%
jan 1, 1997
-19.647
+2.749
-12.27%
jan 1, 1998
-21.085
-1.438
7.32%
jan 1, 1999
-24.388
-3.303
15.67%
jan 1, 2000
-24.852
-0.464
1.9%
jan 1, 2001
-24.501
+0.351
-1.41%
jan 1, 2002
-29.269
-4.768
19.46%
jan 1, 2003
-26.262
+3.006
-10.27%
jan 1, 2004
-32.468
-6.206
23.63%
jan 1, 2005
-30.076
+2.392
-7.37%
jan 1, 2006
-34.291
-4.215
14.01%
jan 1, 2007
-33.909
+0.382
-1.11%
jan 1, 2008
-33.44
+0.47
-1.38%
jan 1, 2009
-32.402
+1.038
-3.1%
jan 1, 2010
-36.702
-4.3
13.27%
jan 1, 2011
-40.28
-3.578
9.75%
jan 1, 2012
-39.683
+0.597
-1.48%
jan 1, 2013
-39.085
+0.597
-1.5%
Ranking of countries by current statistics by years