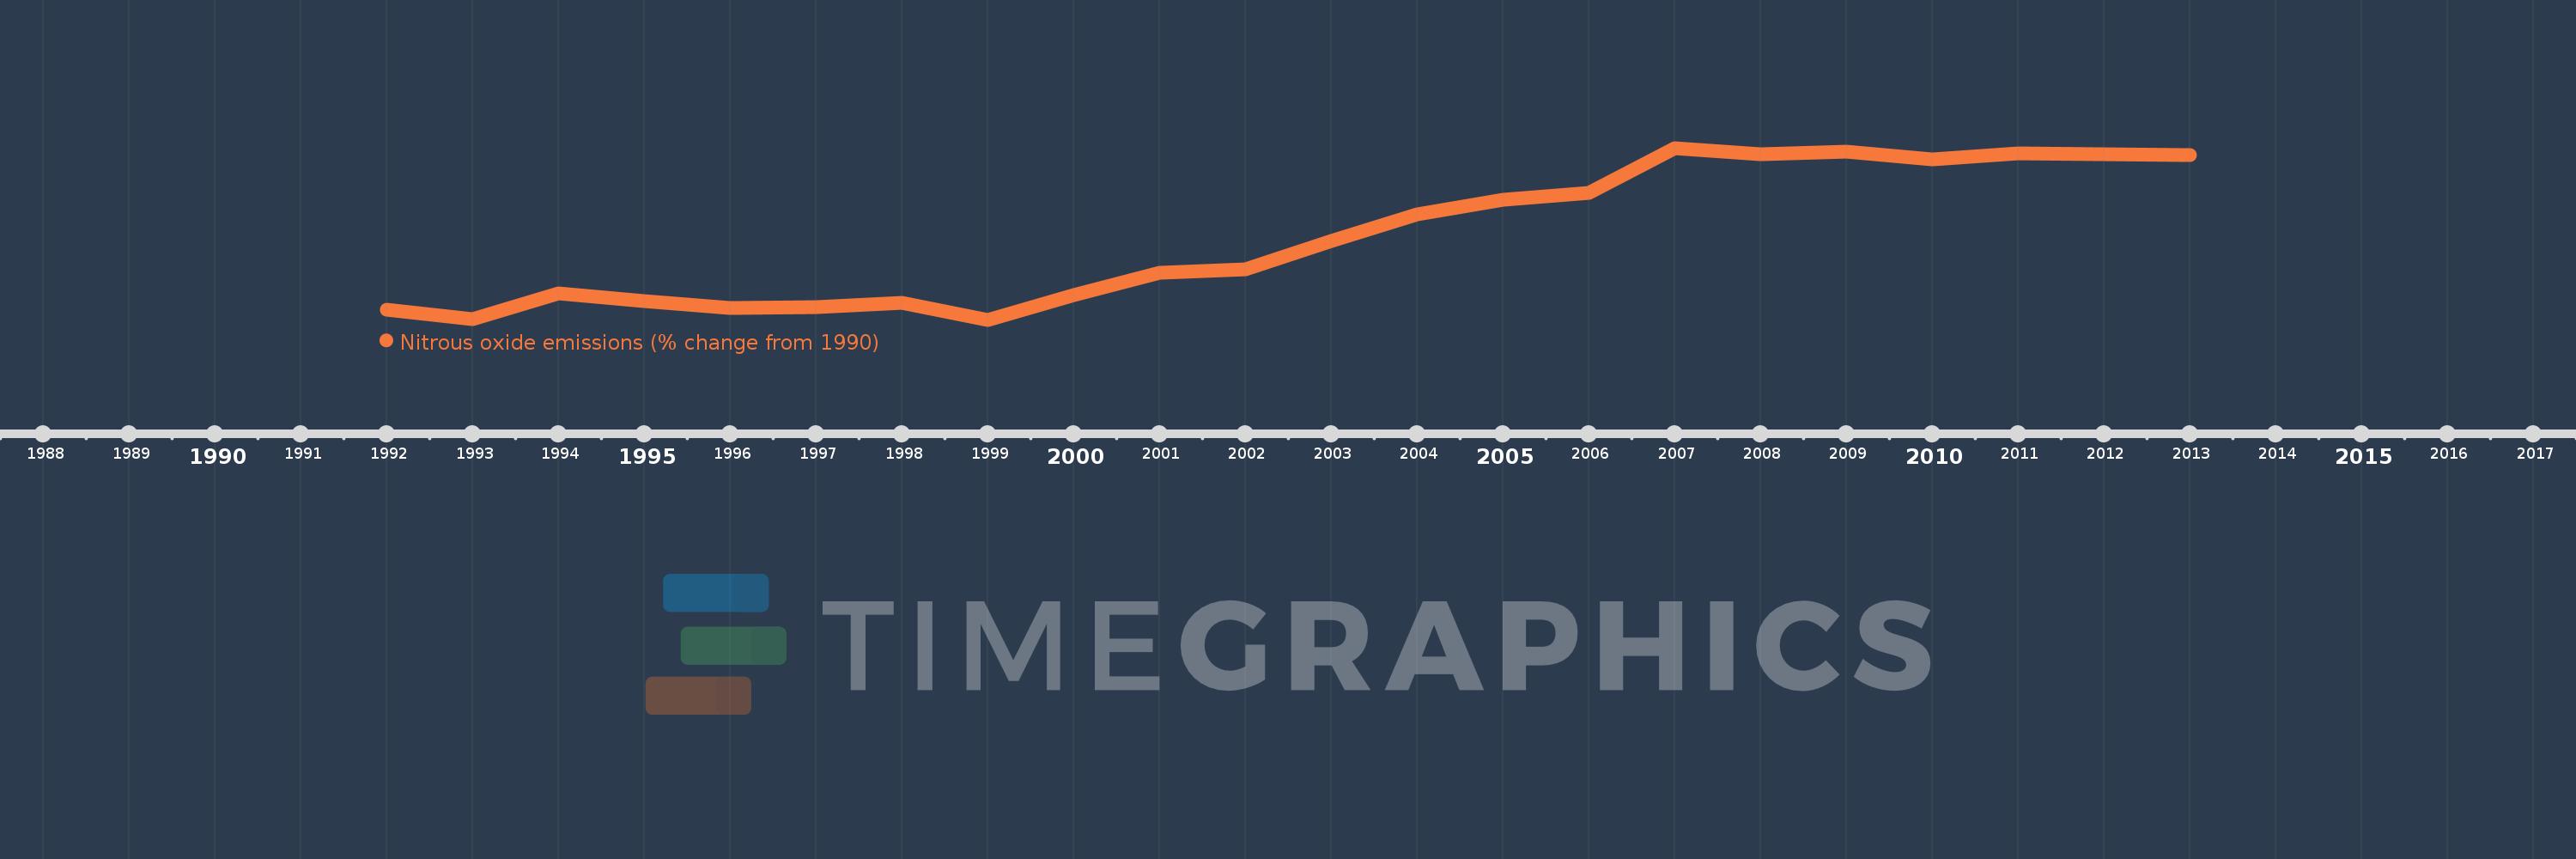
This timeline shows a graph from 1992 to 2013 of Turkmenistan. No data until 1991. Number of actual observations by date: 22.
Source name:
World Development Indicators
Source organization:
World Bank staff estimates from original source: European Commission, Joint Research Centre (JRC)/Netherlands Environmental Assessment Agency (PBL). Emission Database for Global Atmospheric Research (EDGAR): http://edgar.jrc.ec.europa.eu/.
Categories, topics:
Climate Change, Environment
Last updated:
apr 23, 2017
Indicators value changes by year
Meaning:
58.012
Minimum:
0.324
jan 1, 1999
Maximum:
120.631
jan 1, 2007
At the date of observation
Value
Absolute change
Change from the previous value
jan 1, 1992
7.281
+7.281
0.0%
jan 1, 1993
0.673
-6.608
-90.76%
jan 1, 1994
18.644
+17.971
2.67K%
jan 1, 1995
13.352
-5.293
-28.39%
jan 1, 1996
8.599
-4.752
-35.59%
jan 1, 1997
9.016
+0.417
4.85%
jan 1, 1998
12.199
+3.183
35.3%
jan 1, 1999
0.324
-11.876
-97.34%
jan 1, 2000
17.566
+17.242
5.32K%
jan 1, 2001
33.268
+15.702
89.39%
jan 1, 2002
35.564
+2.296
6.9%
jan 1, 2003
55.589
+20.025
56.31%
jan 1, 2004
74.198
+18.609
33.48%
jan 1, 2005
84.285
+10.087
13.6%
jan 1, 2006
89.471
+5.185
6.15%
jan 1, 2007
120.631
+31.16
34.83%
jan 1, 2008
116.525
-4.106
-3.4%
jan 1, 2009
118.196
+1.671
1.43%
jan 1, 2010
112.506
-5.69
-4.81%
jan 1, 2011
116.808
+4.302
3.82%
jan 1, 2012
116.123
-0.685
-0.59%
jan 1, 2013
115.438
-0.685
-0.59%
Ranking of countries by current statistics by years