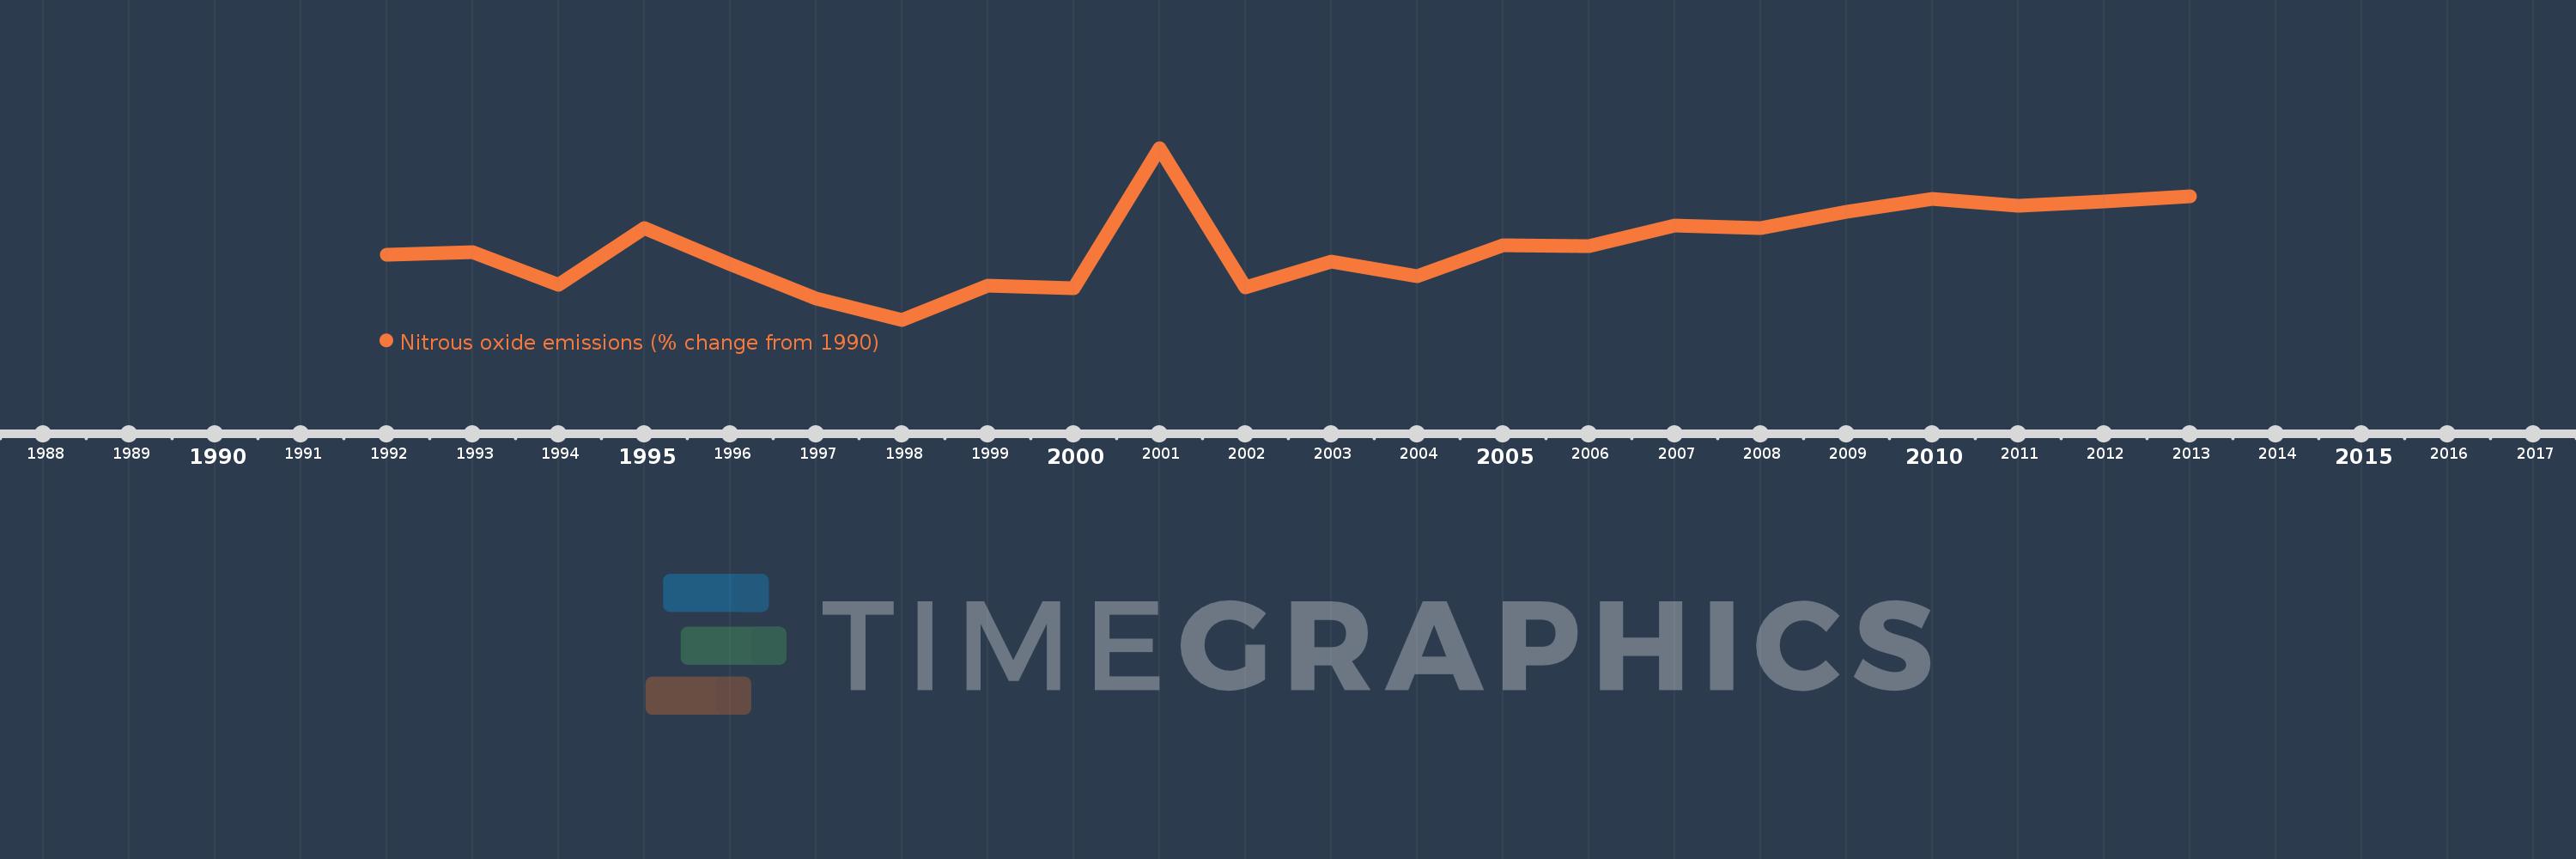
This timeline shows a graph from 1992 to 2013 of Albania. No data until 1991. Number of actual observations by date: 22.
Source name:
World Development Indicators
Source organization:
World Bank staff estimates from original source: European Commission, Joint Research Centre (JRC)/Netherlands Environmental Assessment Agency (PBL). Emission Database for Global Atmospheric Research (EDGAR): http://edgar.jrc.ec.europa.eu/.
Categories, topics:
Climate Change, Environment
Last updated:
apr 23, 2017
Indicators value changes by year
Meaning:
-34.155
Minimum:
-45.591
jan 1, 1998
Maximum:
-19.017
jan 1, 2001
At the date of observation
Value
Absolute change
Change from the previous value
jan 1, 1992
-35.499
-35.499
0.0%
jan 1, 1993
-35.11
+0.389
-1.1%
jan 1, 1994
-40.159
-5.049
14.38%
jan 1, 1995
-31.443
+8.716
-21.7%
jan 1, 1996
-37.036
-5.593
17.79%
jan 1, 1997
-42.255
-5.218
14.09%
jan 1, 1998
-45.591
-3.336
7.9%
jan 1, 1999
-40.368
+5.223
-11.46%
jan 1, 2000
-40.655
-0.287
0.71%
jan 1, 2001
-19.017
+21.638
-53.22%
jan 1, 2002
-40.581
-21.564
113.39%
jan 1, 2003
-36.594
+3.987
-9.82%
jan 1, 2004
-38.795
-2.201
6.02%
jan 1, 2005
-34.033
+4.762
-12.28%
jan 1, 2006
-34.222
-0.189
0.56%
jan 1, 2007
-31.047
+3.175
-9.28%
jan 1, 2008
-31.391
-0.344
1.11%
jan 1, 2009
-28.868
+2.523
-8.04%
jan 1, 2010
-26.957
+1.911
-6.62%
jan 1, 2011
-27.981
-1.025
3.8%
jan 1, 2012
-27.261
+0.72
-2.57%
jan 1, 2013
-26.541
+0.72
-2.64%
Ranking of countries by current statistics by years