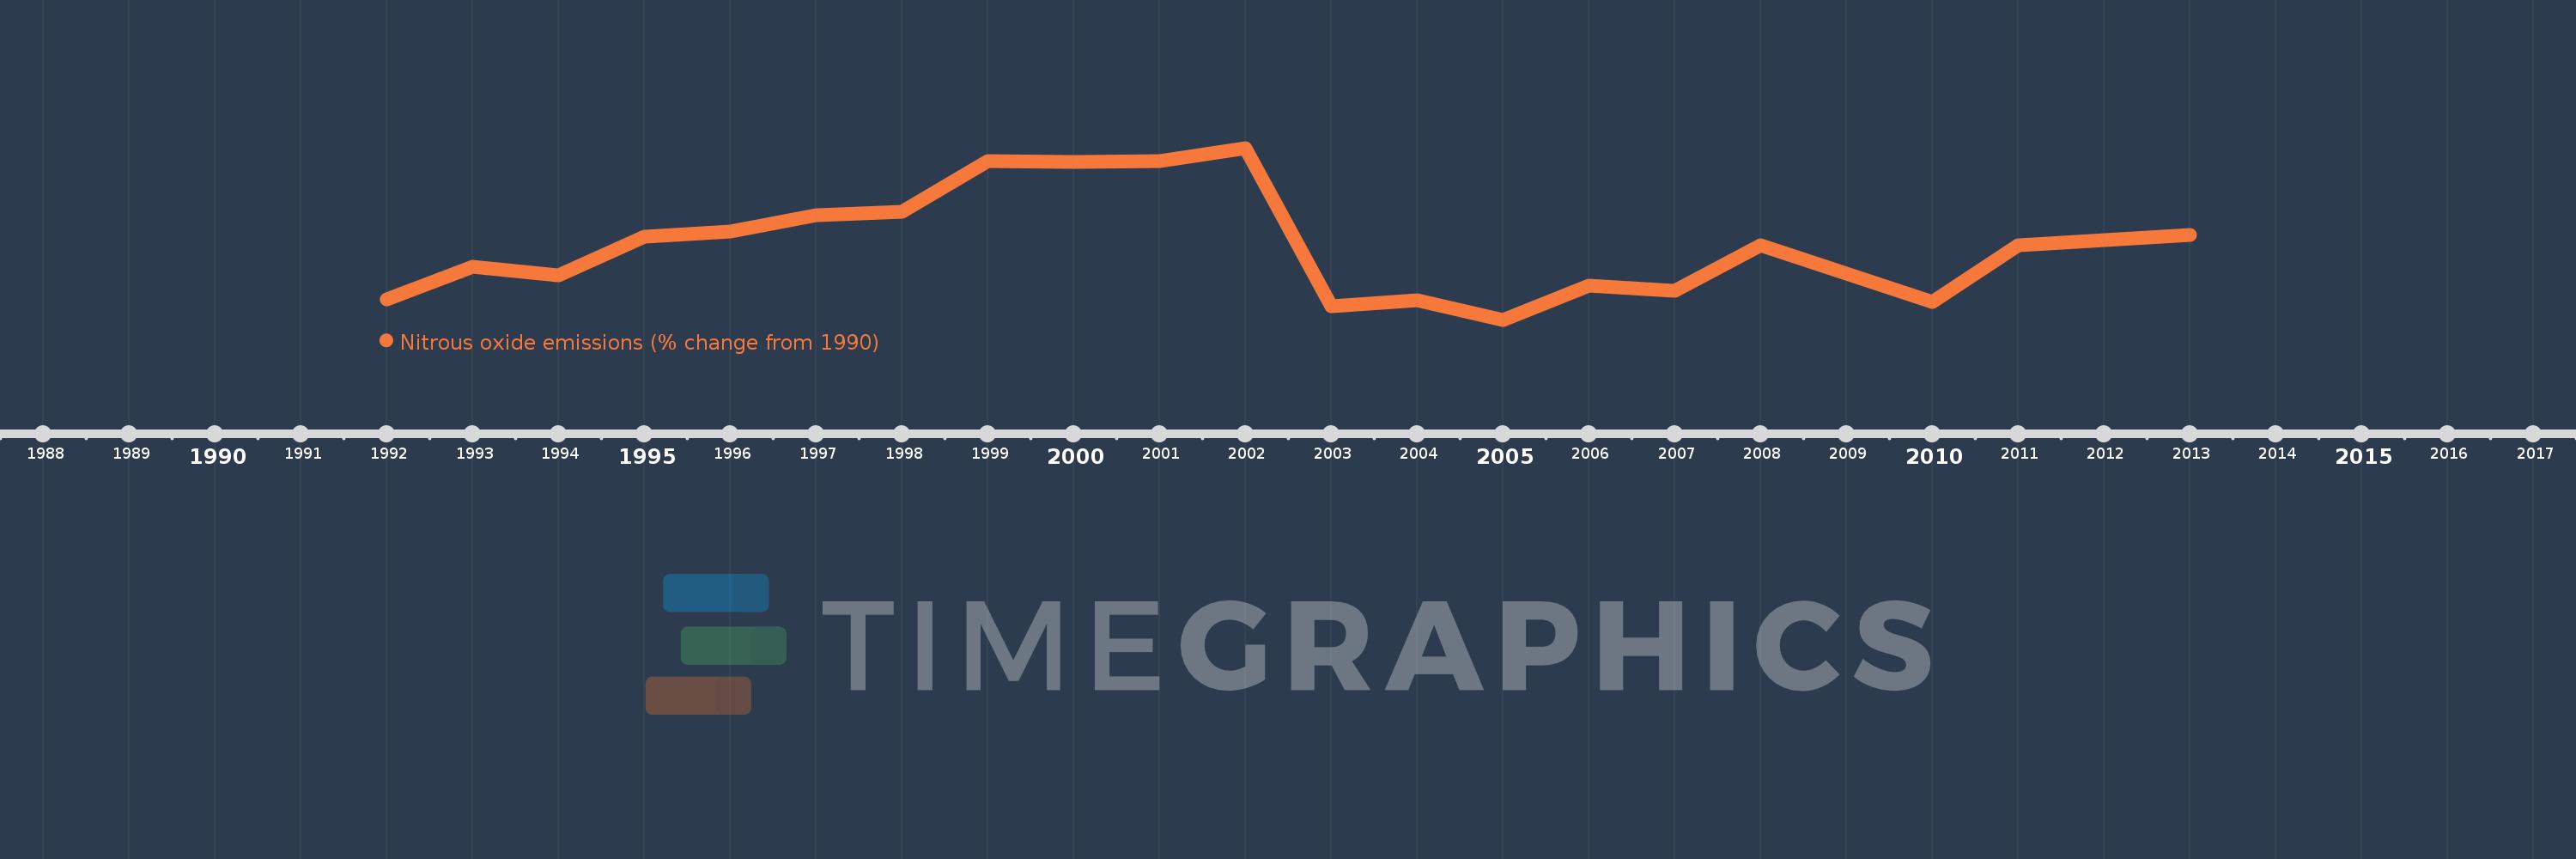
This timeline shows a graph from 1992 to 2013 of Niger. No data until 1991. Number of actual observations by date: 22.
Source name:
World Development Indicators
Source organization:
World Bank staff estimates from original source: European Commission, Joint Research Centre (JRC)/Netherlands Environmental Assessment Agency (PBL). Emission Database for Global Atmospheric Research (EDGAR): http://edgar.jrc.ec.europa.eu/.
Categories, topics:
Climate Change, Environment
Last updated:
apr 23, 2017
Indicators value changes by year
Meaning:
17.388
Minimum:
-0.783
jan 1, 2005
Maximum:
41.525
jan 1, 2002
At the date of observation
Value
Absolute change
Change from the previous value
jan 1, 1992
4.253
+4.253
0.0%
jan 1, 1993
12.349
+8.096
190.34%
jan 1, 1994
10.254
-2.096
-16.97%
jan 1, 1995
19.672
+9.419
91.86%
jan 1, 1996
20.982
+1.31
6.66%
jan 1, 1997
24.905
+3.923
18.7%
jan 1, 1998
25.777
+0.873
3.51%
jan 1, 1999
38.209
+12.432
48.23%
jan 1, 2000
38.142
-0.068
-0.18%
jan 1, 2001
38.357
+0.215
0.56%
jan 1, 2002
41.525
+3.168
8.26%
jan 1, 2003
2.491
-39.034
-94.0%
jan 1, 2004
3.981
+1.49
59.8%
jan 1, 2005
-0.783
-4.764
-119.67%
jan 1, 2006
7.716
+8.499
-1.09K%
jan 1, 2007
6.378
-1.338
-17.34%
jan 1, 2008
17.537
+11.159
174.96%
jan 1, 2009
10.639
-6.898
-39.33%
jan 1, 2010
3.642
-6.997
-65.77%
jan 1, 2011
17.659
+14.017
384.86%
jan 1, 2012
18.835
+1.177
6.66%
jan 1, 2013
20.012
+1.177
6.25%
Ranking of countries by current statistics by years