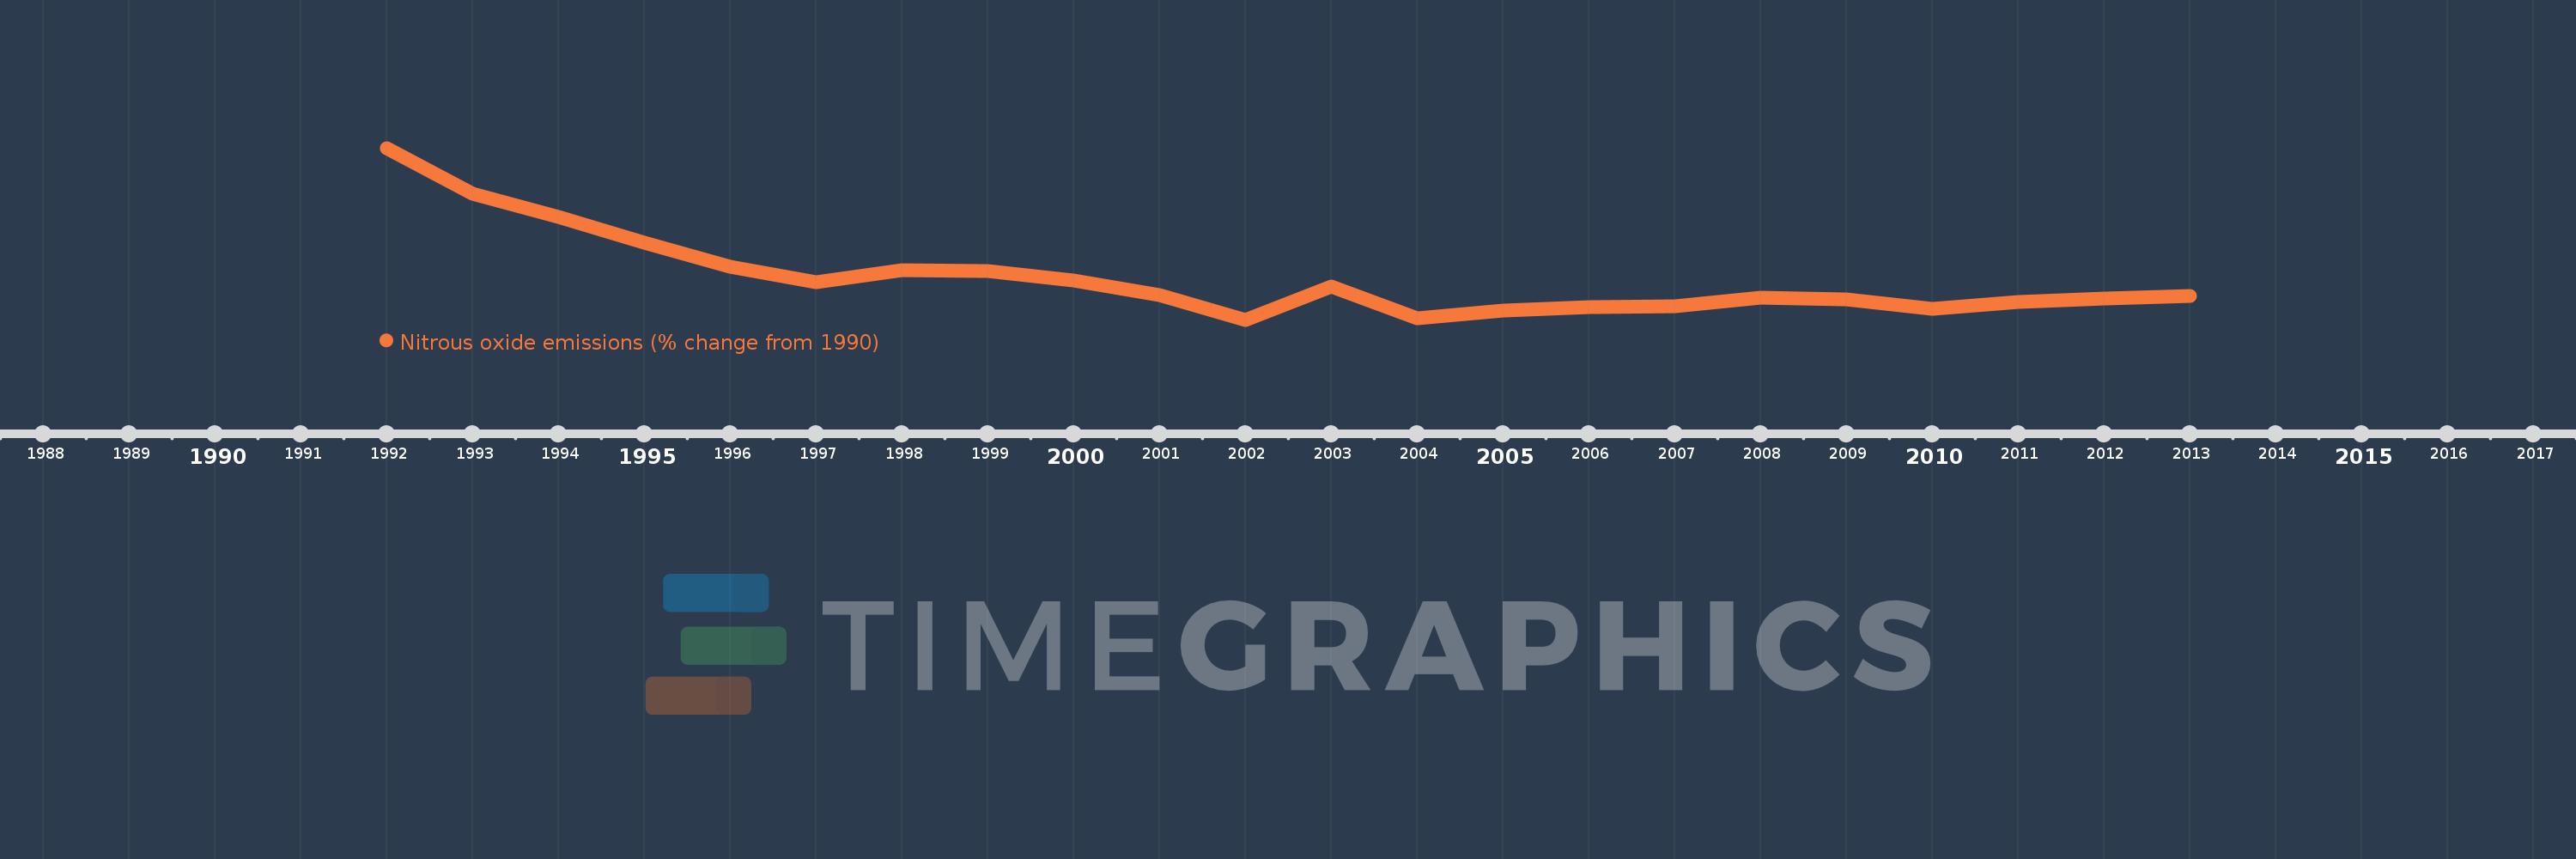
This timeline shows a graph from 1992 to 2013 of Estonia. No data until 1991. Number of actual observations by date: 22.
Source name:
World Development Indicators
Source organization:
World Bank staff estimates from original source: European Commission, Joint Research Centre (JRC)/Netherlands Environmental Assessment Agency (PBL). Emission Database for Global Atmospheric Research (EDGAR): http://edgar.jrc.ec.europa.eu/.
Categories, topics:
Climate Change, Environment
Last updated:
apr 23, 2017
Indicators value changes by year
Meaning:
-46.283
Minimum:
-60.381
jan 1, 2002
Maximum:
-2.252
jan 1, 1992
At the date of observation
Value
Absolute change
Change from the previous value
jan 1, 1992
-2.252
-2.252
0.0%
jan 1, 1993
-17.66
-15.407
684.06%
jan 1, 1994
-25.65
-7.99
45.25%
jan 1, 1995
-34.389
-8.739
34.07%
jan 1, 1996
-42.436
-8.046
23.4%
jan 1, 1997
-47.687
-5.251
12.37%
jan 1, 1998
-43.541
+4.146
-8.69%
jan 1, 1999
-43.885
-0.344
0.79%
jan 1, 2000
-47.171
-3.286
7.49%
jan 1, 2001
-51.98
-4.809
10.19%
jan 1, 2002
-60.381
-8.402
16.16%
jan 1, 2003
-49.253
+11.128
-18.43%
jan 1, 2004
-59.753
-10.5
21.32%
jan 1, 2005
-57.29
+2.463
-4.12%
jan 1, 2006
-56.098
+1.191
-2.08%
jan 1, 2007
-55.955
+0.144
-0.26%
jan 1, 2008
-52.948
+3.007
-5.37%
jan 1, 2009
-53.55
-0.602
1.14%
jan 1, 2010
-56.64
-3.09
5.77%
jan 1, 2011
-54.226
+2.414
-4.26%
jan 1, 2012
-53.238
+0.987
-1.82%
jan 1, 2013
-52.251
+0.987
-1.85%
Ranking of countries by current statistics by years