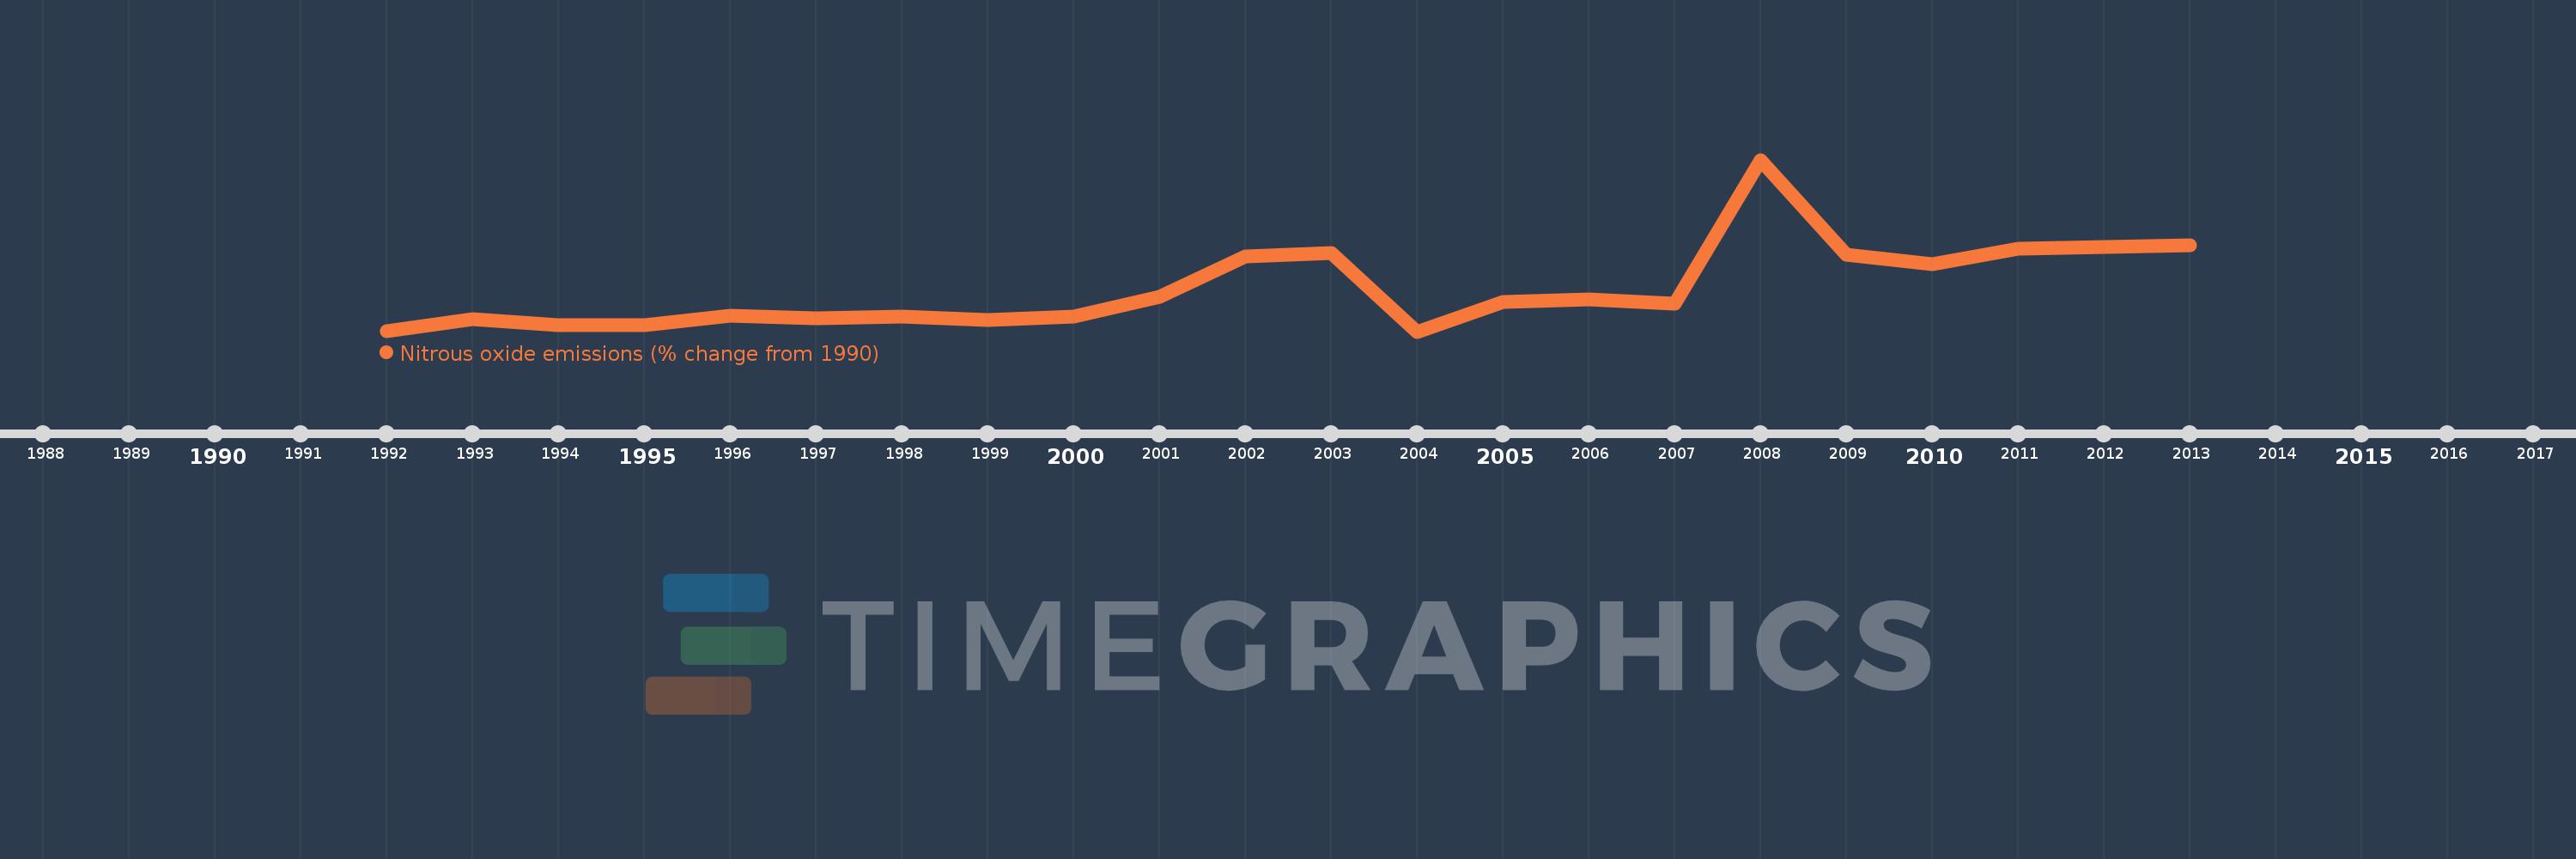
This timeline shows a graph from 1992 to 2013 of Gambia, The. No data until 1991. Number of actual observations by date: 22.
Source name:
World Development Indicators
Source organization:
World Bank staff estimates from original source: European Commission, Joint Research Centre (JRC)/Netherlands Environmental Assessment Agency (PBL). Emission Database for Global Atmospheric Research (EDGAR): http://edgar.jrc.ec.europa.eu/.
Categories, topics:
Climate Change, Environment
Last updated:
apr 23, 2017
Indicators value changes by year
Meaning:
19.165
Minimum:
-11.854
jan 1, 2004
Maximum:
112.58
jan 1, 2008
At the date of observation
Value
Absolute change
Change from the previous value
jan 1, 1992
-11.758
-11.758
0.0%
jan 1, 1993
-3.076
+8.682
-73.84%
jan 1, 1994
-7.173
-4.097
133.2%
jan 1, 1995
-7.198
-0.025
0.35%
jan 1, 1996
-0.507
+6.691
-92.95%
jan 1, 1997
-2.35
-1.842
363.1%
jan 1, 1998
-0.732
+1.618
-68.84%
jan 1, 1999
-3.497
-2.765
377.75%
jan 1, 2000
-1.076
+2.422
-69.25%
jan 1, 2001
13.212
+14.288
-1.33K%
jan 1, 2002
42.527
+29.314
221.87%
jan 1, 2003
44.798
+2.271
5.34%
jan 1, 2004
-11.854
-56.651
-126.46%
jan 1, 2005
9.568
+21.422
-180.72%
jan 1, 2006
11.36
+1.792
18.73%
jan 1, 2007
8.089
-3.271
-28.79%
jan 1, 2008
112.58
+104.491
1.29K%
jan 1, 2009
43.592
-68.989
-61.28%
jan 1, 2010
36.775
-6.817
-15.64%
jan 1, 2011
47.971
+11.196
30.44%
jan 1, 2012
49.451
+1.48
3.08%
jan 1, 2013
50.93
+1.48
2.99%
Ranking of countries by current statistics by years