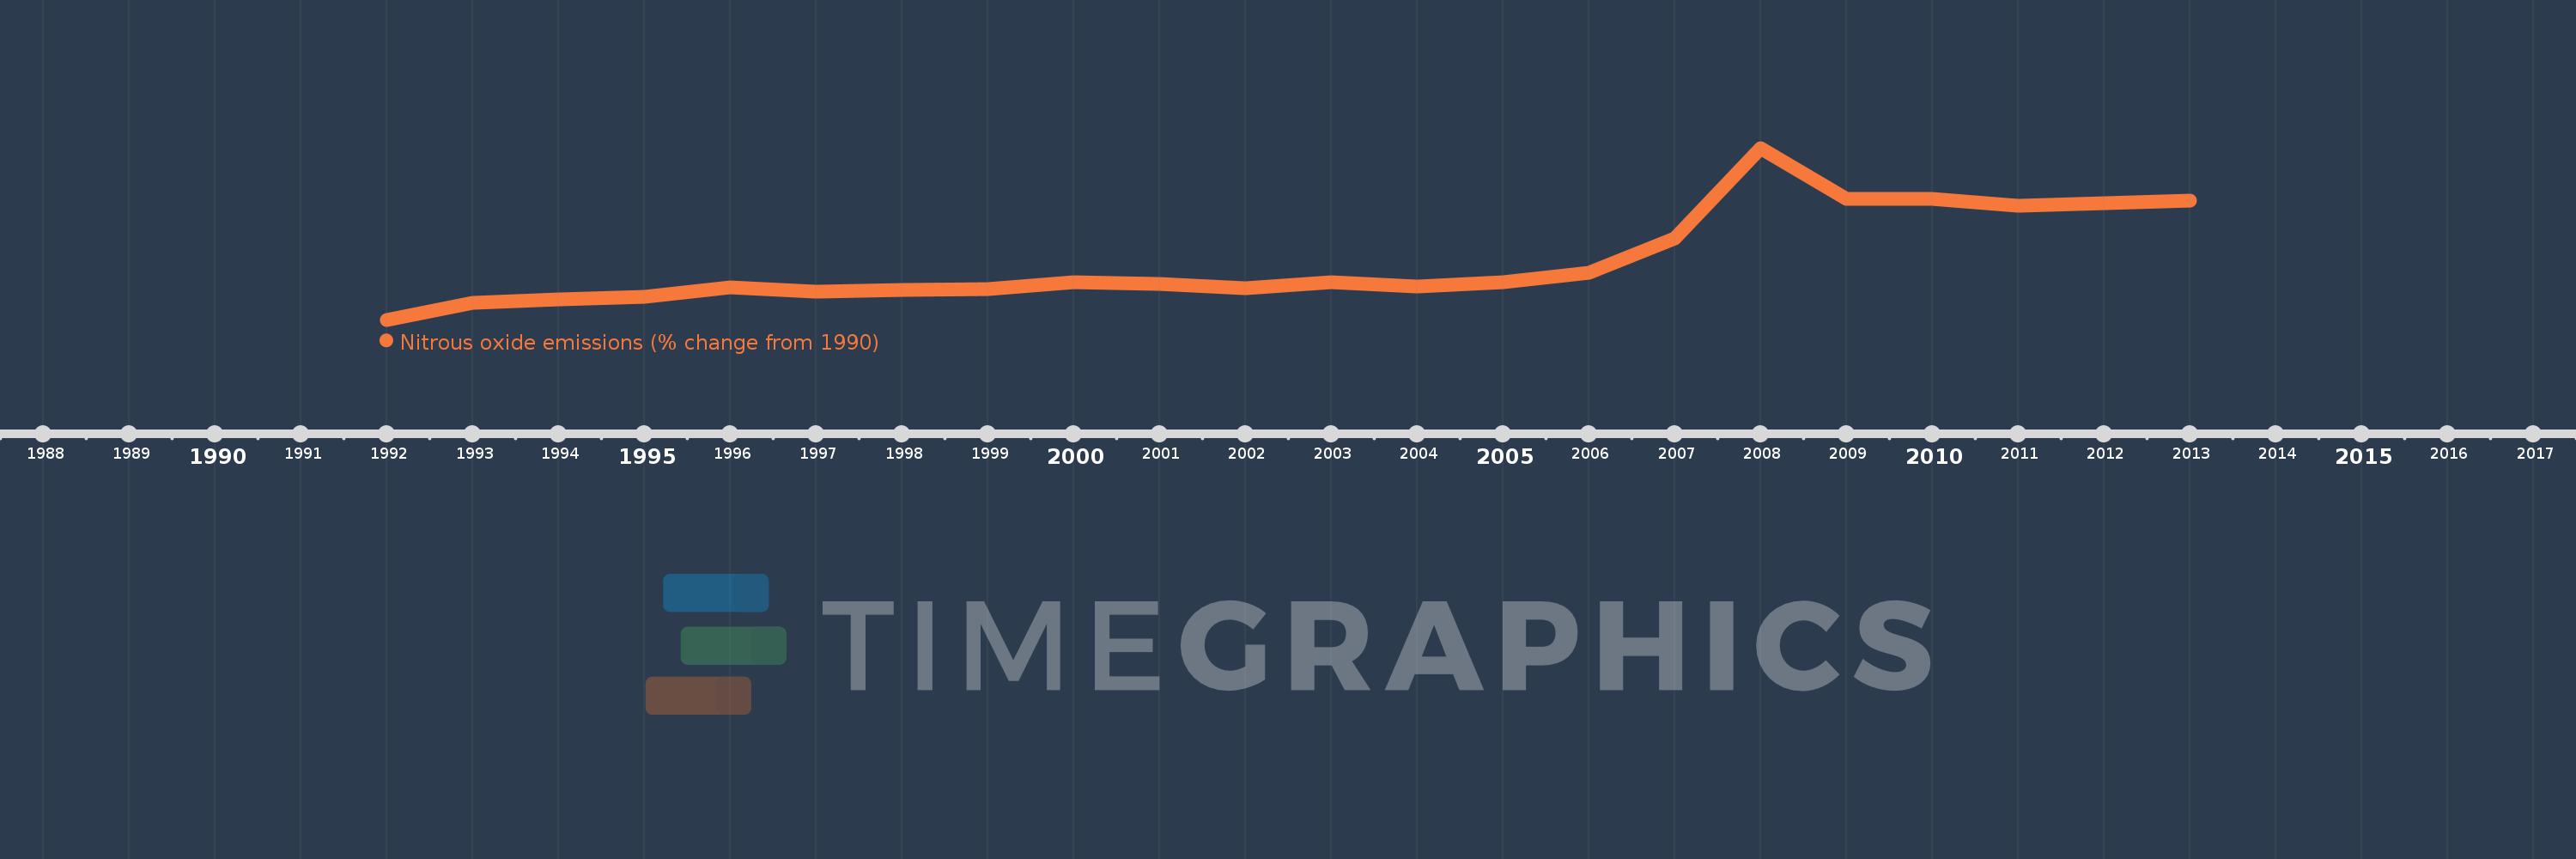
This timeline shows a graph from 1992 to 2013 of Arab World. No data until 1991. Number of actual observations by date: 22.
Source name:
World Development Indicators
Source organization:
World Bank staff estimates from original source: European Commission, Joint Research Centre (JRC)/Netherlands Environmental Assessment Agency (PBL). Emission Database for Global Atmospheric Research (EDGAR): http://edgar.jrc.ec.europa.eu/.
Categories, topics:
Climate Change, Environment
Last updated:
apr 23, 2017
Indicators value changes by year
Meaning:
28.263
Minimum:
-9.512
jan 1, 1992
Maximum:
101.499
jan 1, 2008
At the date of observation
Value
Absolute change
Change from the previous value
jan 1, 1992
-9.512
-9.512
0.0%
jan 1, 1993
1.613
+11.125
-116.96%
jan 1, 1994
3.856
+2.244
139.11%
jan 1, 1995
5.307
+1.451
37.62%
jan 1, 1996
11.217
+5.91
111.36%
jan 1, 1997
8.699
-2.518
-22.45%
jan 1, 1998
9.474
+0.776
8.92%
jan 1, 1999
10.394
+0.92
9.71%
jan 1, 2000
14.898
+4.503
43.32%
jan 1, 2001
13.862
-1.036
-6.96%
jan 1, 2002
10.859
-3.003
-21.66%
jan 1, 2003
14.543
+3.684
33.92%
jan 1, 2004
11.735
-2.807
-19.3%
jan 1, 2005
14.702
+2.967
25.28%
jan 1, 2006
20.588
+5.886
40.04%
jan 1, 2007
43.321
+22.733
110.42%
jan 1, 2008
101.499
+58.178
134.3%
jan 1, 2009
68.471
-33.028
-32.54%
jan 1, 2010
68.395
-0.076
-0.11%
jan 1, 2011
64.237
-4.158
-6.08%
jan 1, 2012
65.954
+1.717
2.67%
jan 1, 2013
67.671
+1.717
2.6%
Ranking of countries by current statistics by years