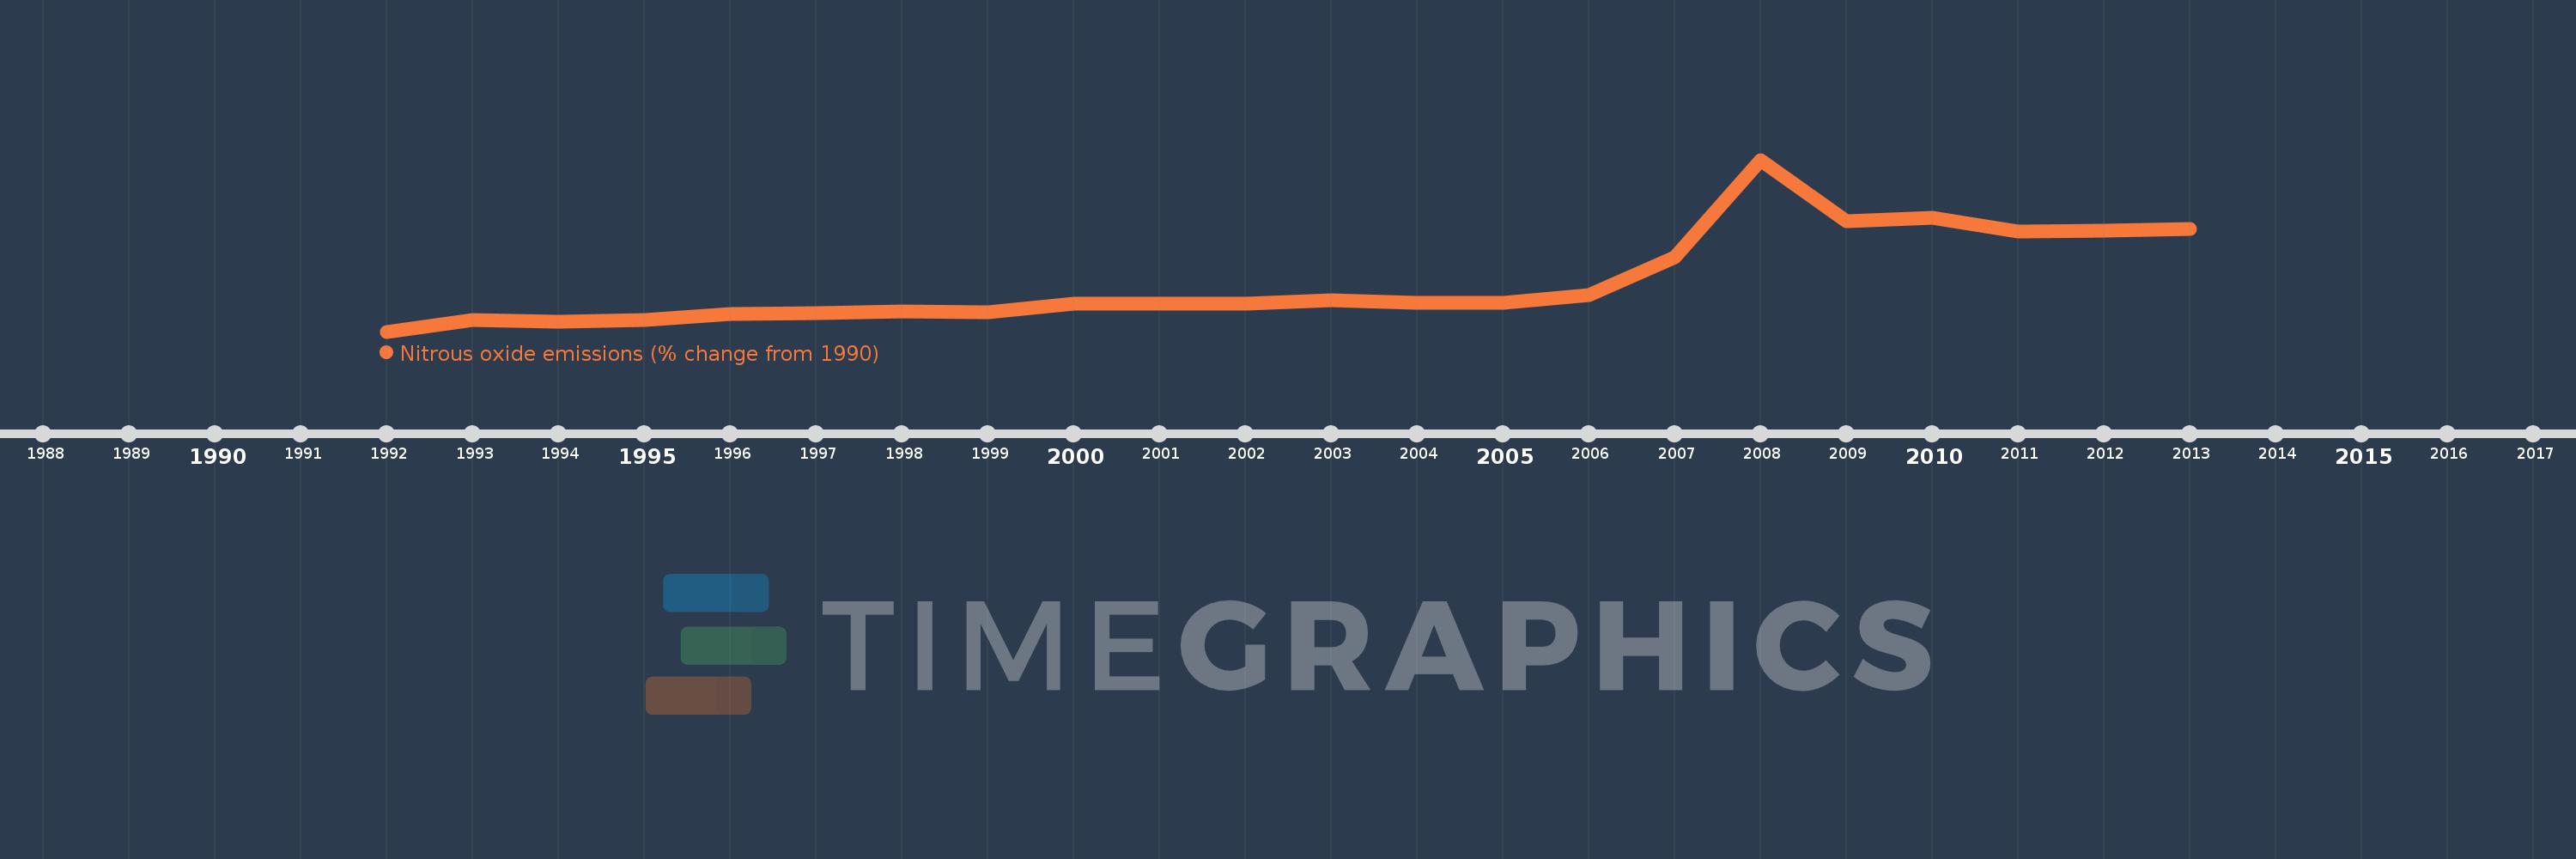
This timeline shows a graph from 1992 to 2013 of Sudan. No data until 1991. Number of actual observations by date: 22.
Source name:
World Development Indicators
Source organization:
World Bank staff estimates from original source: European Commission, Joint Research Centre (JRC)/Netherlands Environmental Assessment Agency (PBL). Emission Database for Global Atmospheric Research (EDGAR): http://edgar.jrc.ec.europa.eu/.
Categories, topics:
Climate Change, Environment
Last updated:
apr 23, 2017
Indicators value changes by year
Meaning:
54.976
Minimum:
-20.459
jan 1, 1992
Maximum:
241.118
jan 1, 2008
At the date of observation
Value
Absolute change
Change from the previous value
jan 1, 1992
-20.459
-20.459
0.0%
jan 1, 1993
-3.149
+17.31
-84.61%
jan 1, 1994
-5.826
-2.677
84.98%
jan 1, 1995
-3.373
+2.453
-42.1%
jan 1, 1996
6.428
+9.802
-290.55%
jan 1, 1997
7.115
+0.687
10.68%
jan 1, 1998
10.653
+3.538
49.73%
jan 1, 1999
8.839
-1.813
-17.02%
jan 1, 2000
21.846
+13.007
147.15%
jan 1, 2001
21.719
-0.127
-0.58%
jan 1, 2002
22.566
+0.847
3.9%
jan 1, 2003
27.302
+4.736
20.99%
jan 1, 2004
22.929
-4.373
-16.02%
jan 1, 2005
23.187
+0.258
1.12%
jan 1, 2006
35.275
+12.089
52.14%
jan 1, 2007
92.28
+57.004
161.6%
jan 1, 2008
241.118
+148.838
161.29%
jan 1, 2009
147.399
-93.718
-38.87%
jan 1, 2010
152.293
+4.894
3.32%
jan 1, 2011
131.46
-20.833
-13.68%
jan 1, 2012
133.775
+2.315
1.76%
jan 1, 2013
136.089
+2.315
1.73%
Ranking of countries by current statistics by years