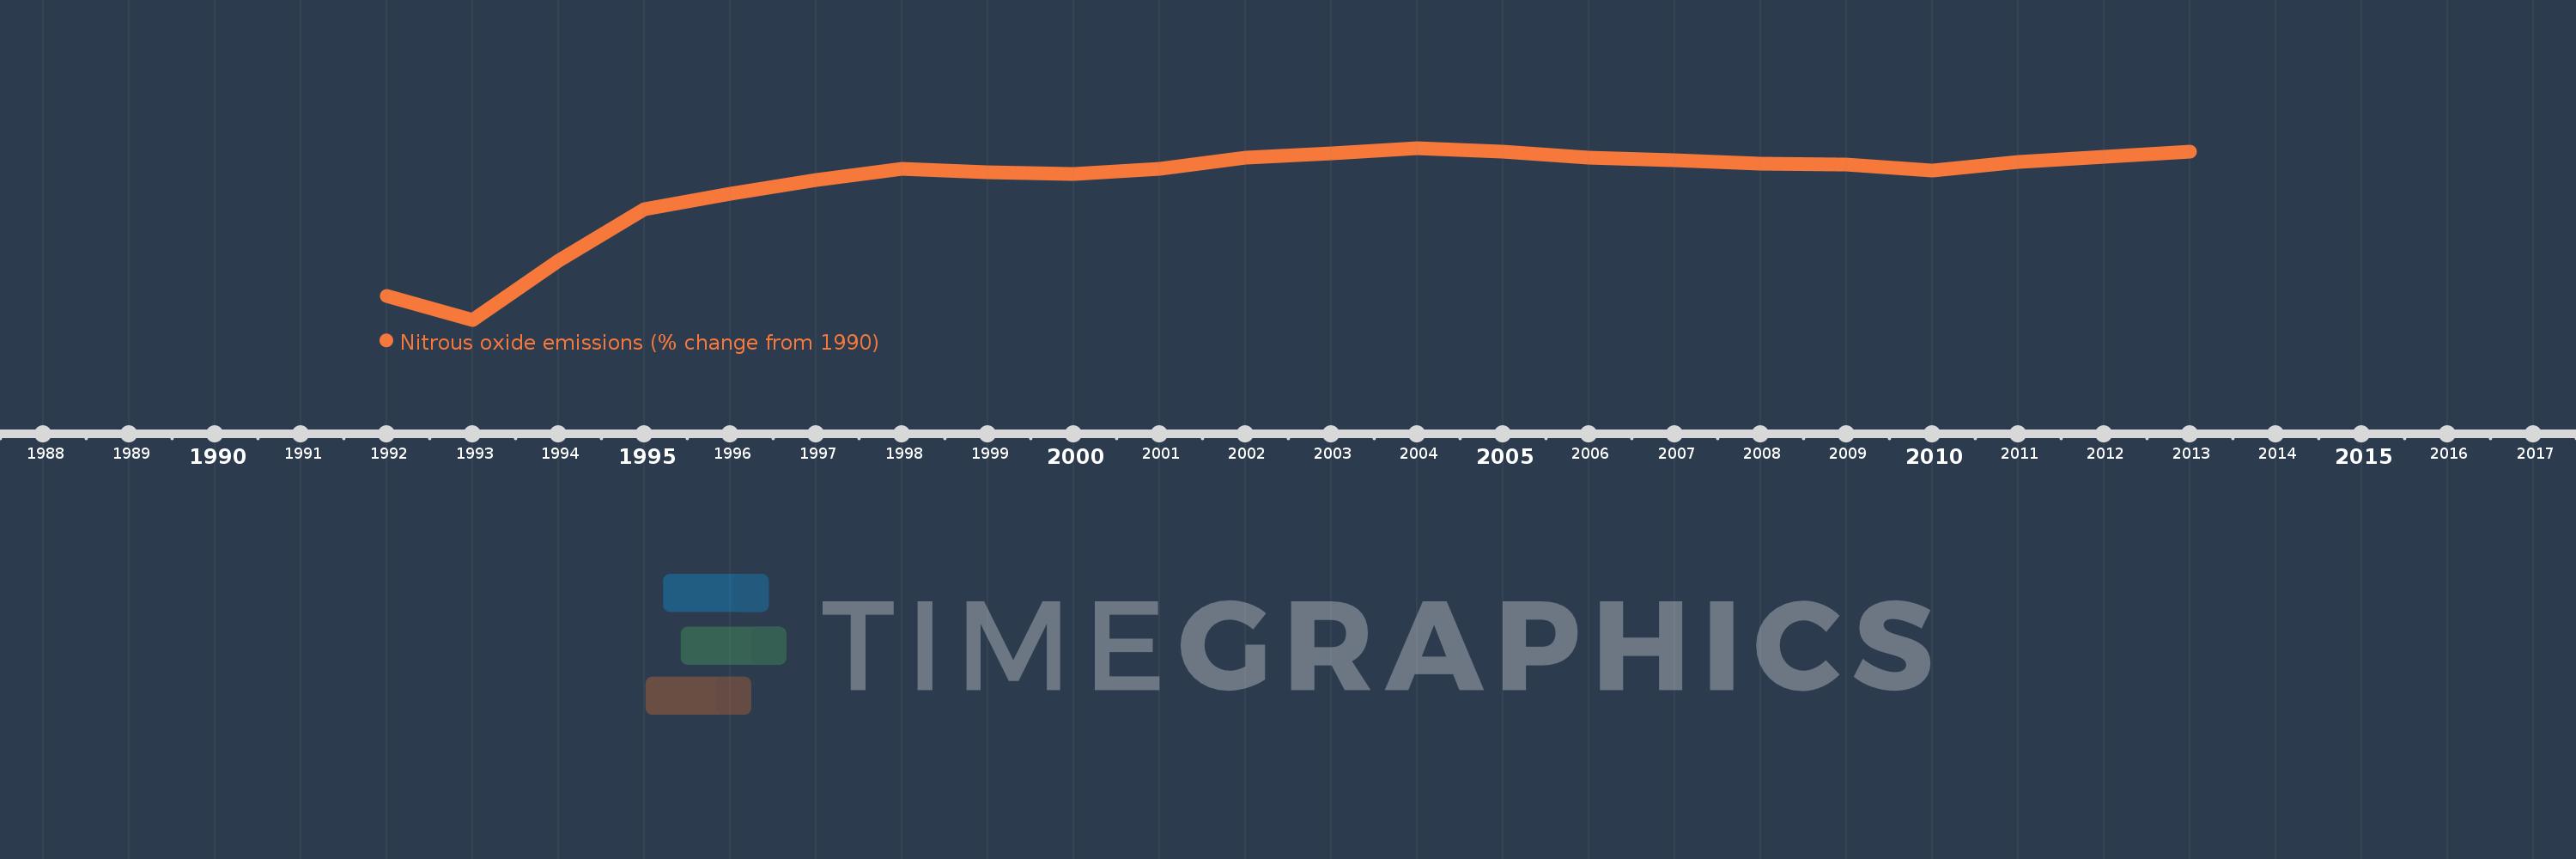
This timeline shows a graph from 1992 to 2013 of Somalia. No data until 1991. Number of actual observations by date: 22.
Source name:
World Development Indicators
Source organization:
World Bank staff estimates from original source: European Commission, Joint Research Centre (JRC)/Netherlands Environmental Assessment Agency (PBL). Emission Database for Global Atmospheric Research (EDGAR): http://edgar.jrc.ec.europa.eu/.
Categories, topics:
Climate Change, Environment
Last updated:
apr 23, 2017
Indicators value changes by year
Meaning:
15.394
Minimum:
-16.612
jan 1, 1993
Maximum:
23.806
jan 1, 2004
At the date of observation
Value
Absolute change
Change from the previous value
jan 1, 1992
-11.013
-11.013
0.0%
jan 1, 1993
-16.612
-5.599
50.84%
jan 1, 1994
-2.704
+13.908
-83.72%
jan 1, 1995
9.421
+12.125
-448.34%
jan 1, 1996
13.044
+3.623
38.45%
jan 1, 1997
16.18
+3.136
24.04%
jan 1, 1998
18.833
+2.653
16.4%
jan 1, 1999
18.036
-0.798
-4.23%
jan 1, 2000
17.779
-0.257
-1.42%
jan 1, 2001
18.873
+1.095
6.16%
jan 1, 2002
21.461
+2.588
13.71%
jan 1, 2003
22.528
+1.067
4.97%
jan 1, 2004
23.806
+1.278
5.67%
jan 1, 2005
23.022
-0.784
-3.29%
jan 1, 2006
21.565
-1.457
-6.33%
jan 1, 2007
20.91
-0.654
-3.03%
jan 1, 2008
20.091
-0.819
-3.92%
jan 1, 2009
19.966
-0.125
-0.62%
jan 1, 2010
18.535
-1.431
-7.17%
jan 1, 2011
20.448
+1.914
10.33%
jan 1, 2012
21.653
+1.204
5.89%
jan 1, 2013
22.857
+1.204
5.56%
Ranking of countries by current statistics by years