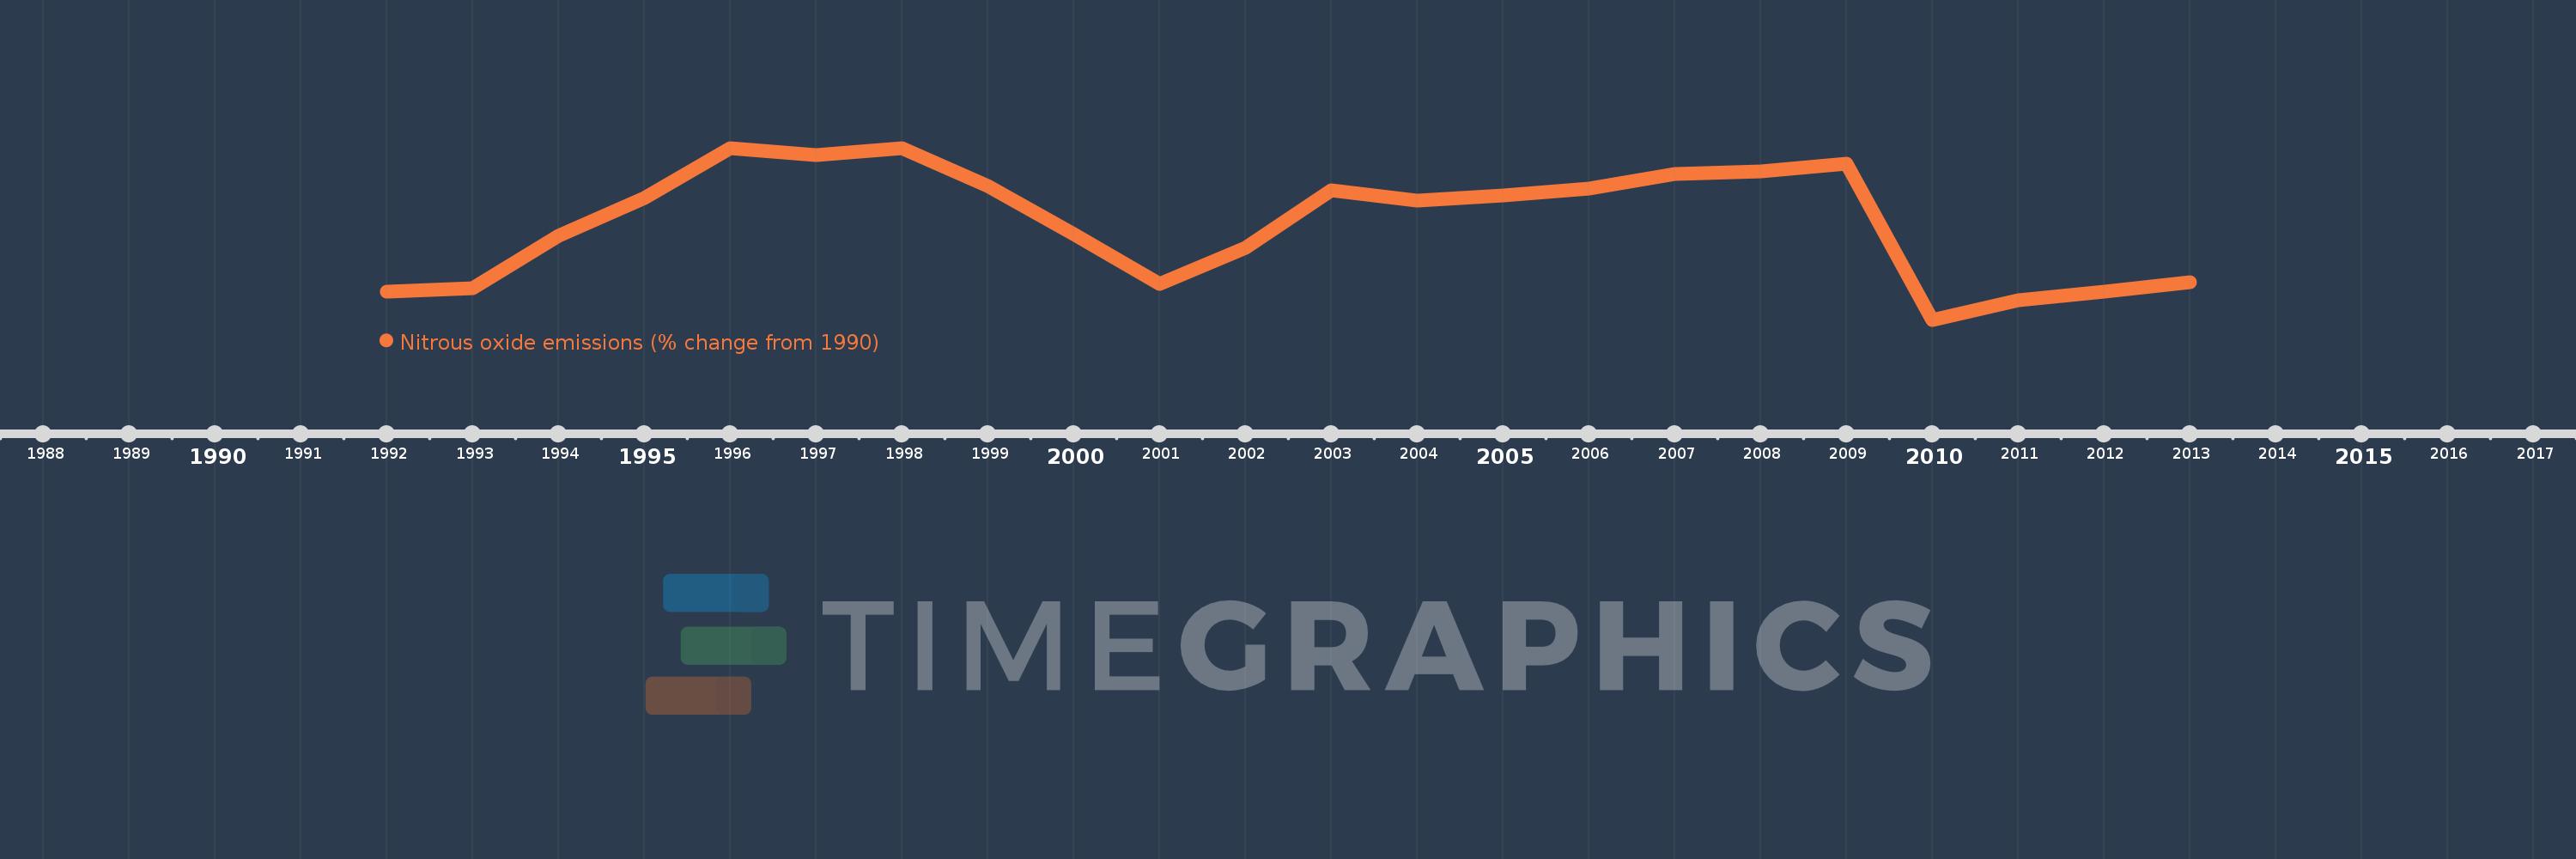
This timeline shows a graph from 1992 to 2013 of Fiji. No data until 1991. Number of actual observations by date: 22.
Source name:
World Development Indicators
Source organization:
World Bank staff estimates from original source: European Commission, Joint Research Centre (JRC)/Netherlands Environmental Assessment Agency (PBL). Emission Database for Global Atmospheric Research (EDGAR): http://edgar.jrc.ec.europa.eu/.
Categories, topics:
Climate Change, Environment
Last updated:
apr 23, 2017
Indicators value changes by year
Meaning:
3.339
Minimum:
-6.877
jan 1, 2010
Maximum:
11.172
jan 1, 1998
At the date of observation
Value
Absolute change
Change from the previous value
jan 1, 1992
-3.955
-3.955
0.0%
jan 1, 1993
-3.545
+0.41
-10.37%
jan 1, 1994
1.92
+5.466
-154.17%
jan 1, 1995
5.878
+3.958
206.1%
jan 1, 1996
11.144
+5.265
89.57%
jan 1, 1997
10.423
-0.721
-6.47%
jan 1, 1998
11.172
+0.749
7.19%
jan 1, 1999
7.212
-3.96
-35.45%
jan 1, 2000
2.097
-5.115
-70.92%
jan 1, 2001
-3.09
-5.187
-247.35%
jan 1, 2002
0.663
+3.753
-121.46%
jan 1, 2003
6.758
+6.095
919.0%
jan 1, 2004
5.634
-1.124
-16.64%
jan 1, 2005
6.176
+0.542
9.63%
jan 1, 2006
6.913
+0.737
11.93%
jan 1, 2007
8.445
+1.533
22.17%
jan 1, 2008
8.732
+0.287
3.4%
jan 1, 2009
9.494
+0.761
8.72%
jan 1, 2010
-6.877
-16.37
-172.44%
jan 1, 2011
-4.86
+2.017
-29.33%
jan 1, 2012
-3.909
+0.951
-19.58%
jan 1, 2013
-2.957
+0.951
-24.34%
Ranking of countries by current statistics by years