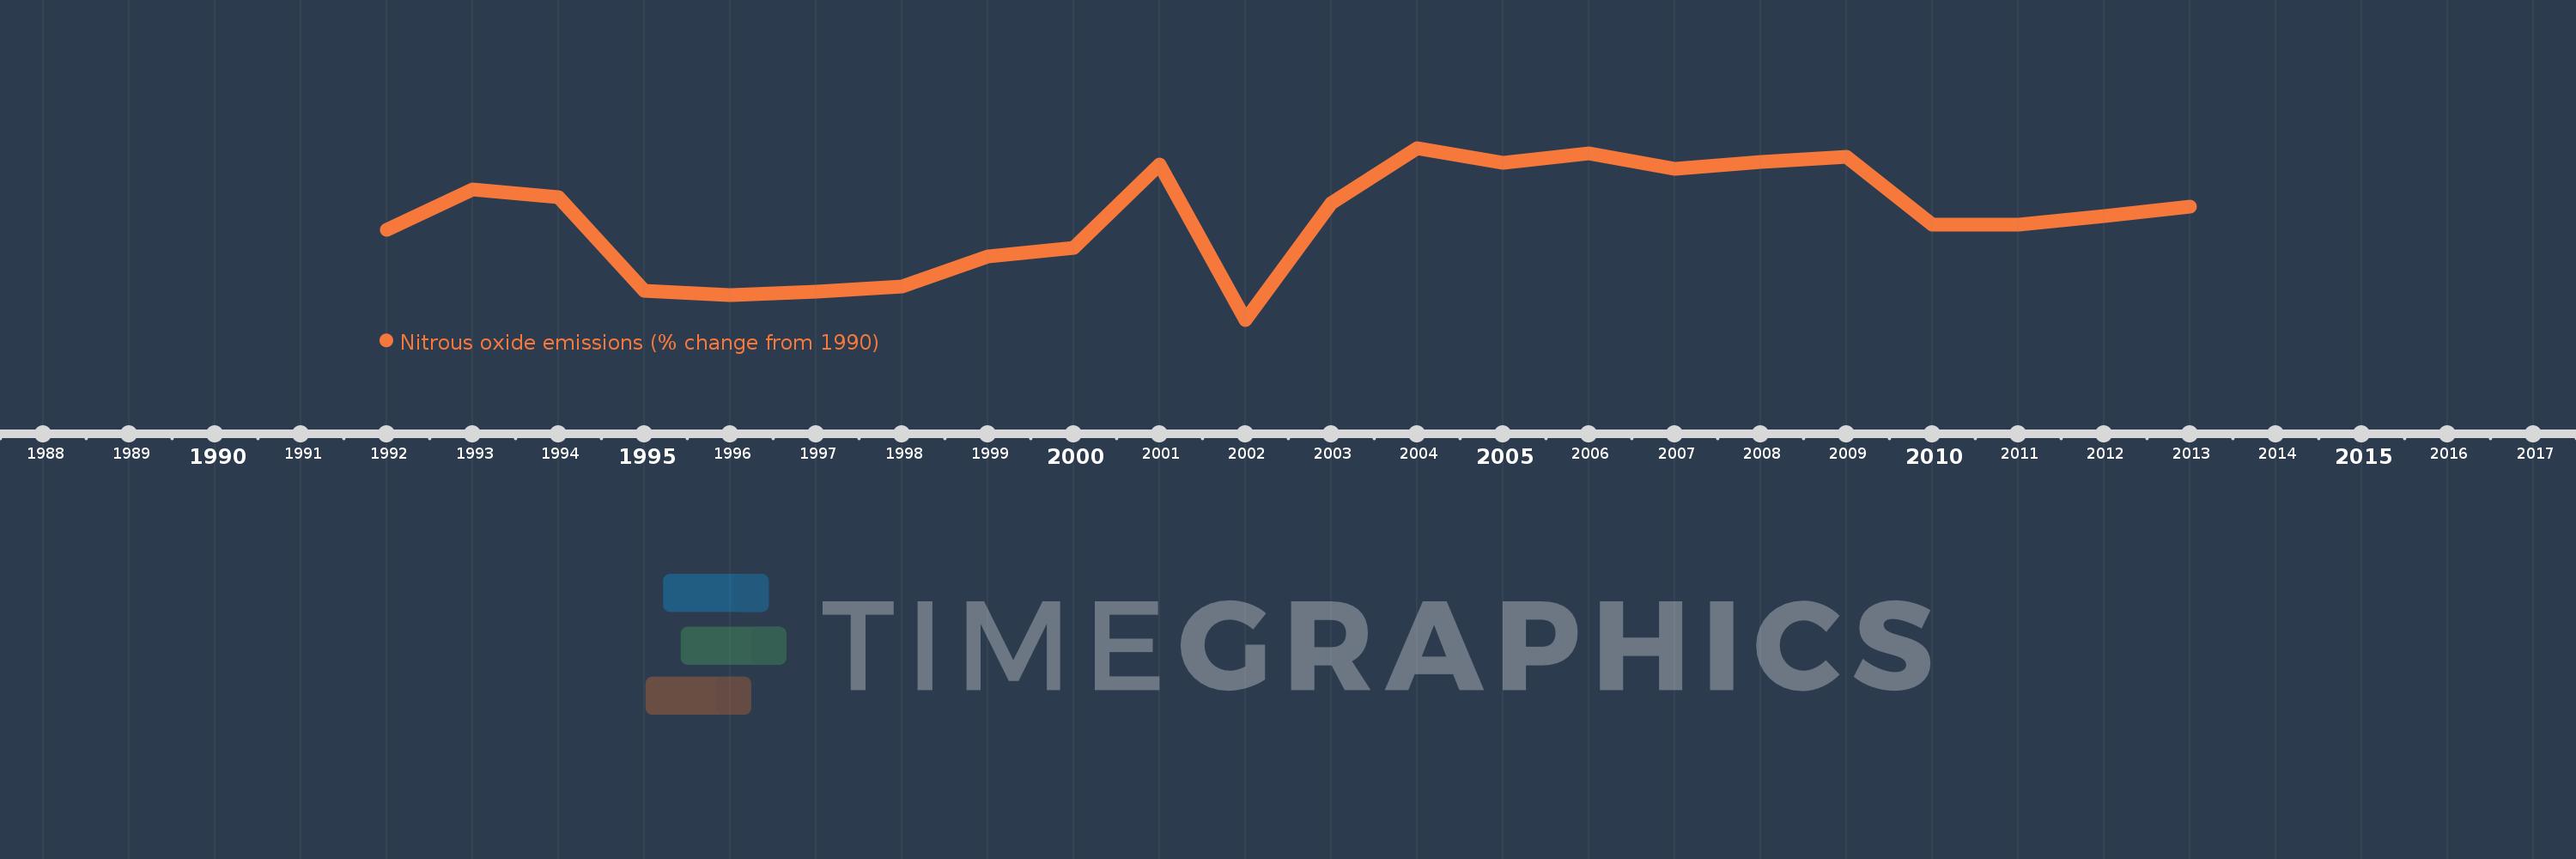
This timeline shows a graph from 1992 to 2013 of French Polynesia. No data until 1991. Number of actual observations by date: 22.
Source name:
World Development Indicators
Source organization:
World Bank staff estimates from original source: European Commission, Joint Research Centre (JRC)/Netherlands Environmental Assessment Agency (PBL). Emission Database for Global Atmospheric Research (EDGAR): http://edgar.jrc.ec.europa.eu/.
Categories, topics:
Climate Change, Environment
Last updated:
apr 23, 2017
Indicators value changes by year
Meaning:
0.488
Minimum:
-10.732
jan 1, 2002
Maximum:
8.219
jan 1, 2004
At the date of observation
Value
Absolute change
Change from the previous value
jan 1, 1992
-0.839
-0.839
0.0%
jan 1, 1993
3.663
+4.502
-536.78%
jan 1, 1994
2.802
-0.861
-23.52%
jan 1, 1995
-7.577
-10.379
-370.46%
jan 1, 1996
-8.025
-0.448
5.91%
jan 1, 1997
-7.666
+0.359
-4.47%
jan 1, 1998
-7.038
+0.628
-8.19%
jan 1, 1999
-3.747
+3.291
-46.77%
jan 1, 2000
-2.76
+0.986
-26.32%
jan 1, 2001
6.361
+9.122
-330.44%
jan 1, 2002
-10.732
-17.094
-268.72%
jan 1, 2003
2.103
+12.835
-119.59%
jan 1, 2004
8.219
+6.116
290.82%
jan 1, 2005
6.556
-1.663
-20.23%
jan 1, 2006
7.613
+1.057
16.12%
jan 1, 2007
5.96
-1.653
-21.71%
jan 1, 2008
6.658
+0.698
11.71%
jan 1, 2009
7.233
+0.575
8.63%
jan 1, 2010
-0.211
-7.443
-102.91%
jan 1, 2011
-0.275
-0.064
30.4%
jan 1, 2012
0.722
+0.997
-362.93%
jan 1, 2013
1.72
+0.997
138.03%
Ranking of countries by current statistics by years