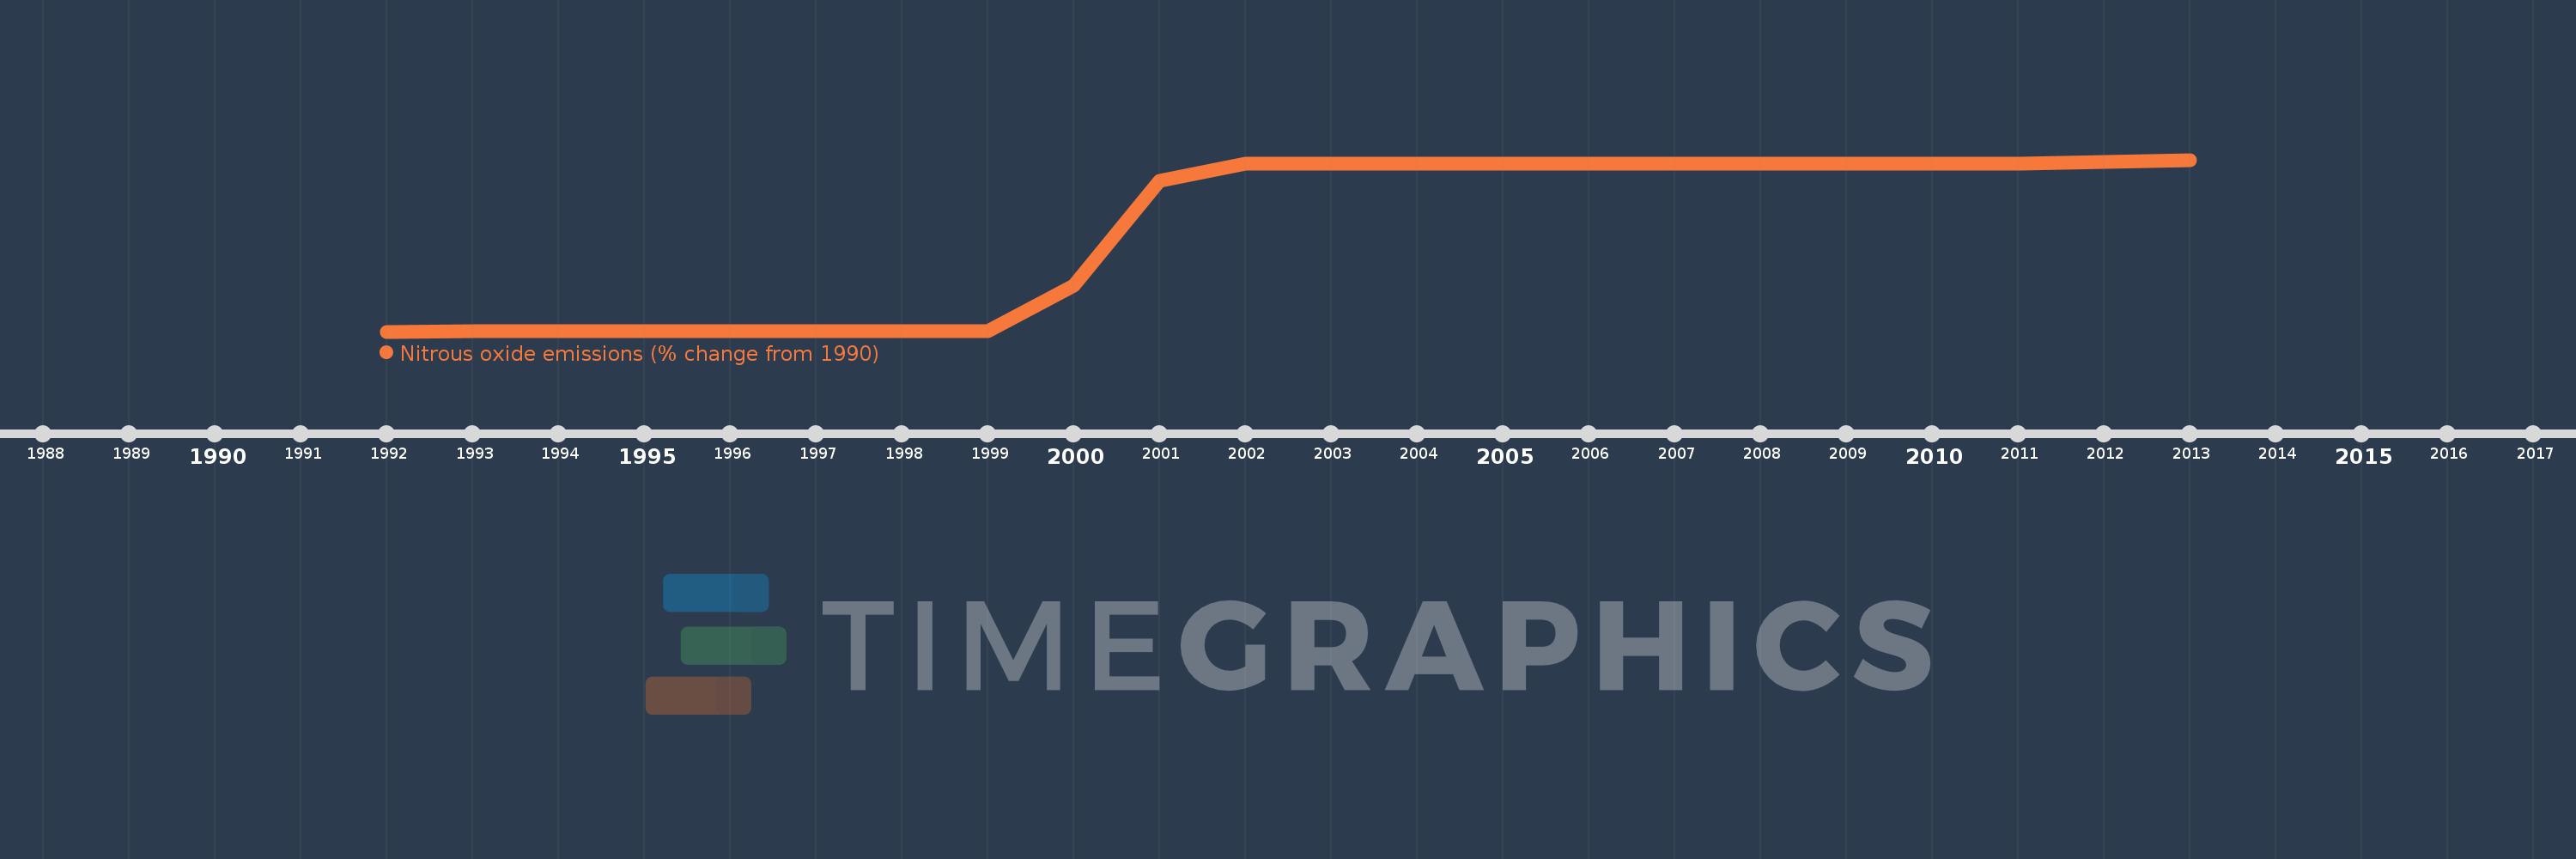
This timeline shows a graph from 1992 to 2013 of American Samoa. No data until 1991. Number of actual observations by date: 22.
Source name:
World Development Indicators
Source organization:
World Bank staff estimates from original source: European Commission, Joint Research Centre (JRC)/Netherlands Environmental Assessment Agency (PBL). Emission Database for Global Atmospheric Research (EDGAR): http://edgar.jrc.ec.europa.eu/.
Categories, topics:
Climate Change, Environment
Last updated:
apr 23, 2017
Indicators value changes by year
Meaning:
1.476K
Minimum:
0.667
jan 1, 1992
Maximum:
2.51K
jan 1, 2013
At the date of observation
Value
Absolute change
Change from the previous value
jan 1, 1992
0.667
+0.667
0.0%
jan 1, 1993
2.426
+1.758
263.46%
jan 1, 1994
2.603
+0.177
7.29%
jan 1, 1995
3.782
+1.18
45.33%
jan 1, 1996
5.748
+1.966
51.99%
jan 1, 1997
6.007
+0.258
4.49%
jan 1, 1998
7.214
+1.207
20.09%
jan 1, 1999
8.118
+0.904
12.54%
jan 1, 2000
666.2
+658.082
8.11K%
jan 1, 2001
2.199K
+1.533K
230.14%
jan 1, 2002
2.458K
+258.442
11.75%
jan 1, 2003
2.458K
+0.331
0.01%
jan 1, 2004
2.458K
+0.202
0.01%
jan 1, 2005
2.458K
-0.458
-0.02%
jan 1, 2006
2.458K
-0.089
0.0%
jan 1, 2007
2.458K
+0.106
0.0%
jan 1, 2008
2.458K
+0.181
0.01%
jan 1, 2009
2.458K
+0.137
0.01%
jan 1, 2010
2.458K
+0.154
0.01%
jan 1, 2011
2.459K
+0.246
0.01%
jan 1, 2012
2.484K
+25.586
1.04%
jan 1, 2013
2.51K
+25.586
1.03%
Ranking of countries by current statistics by years