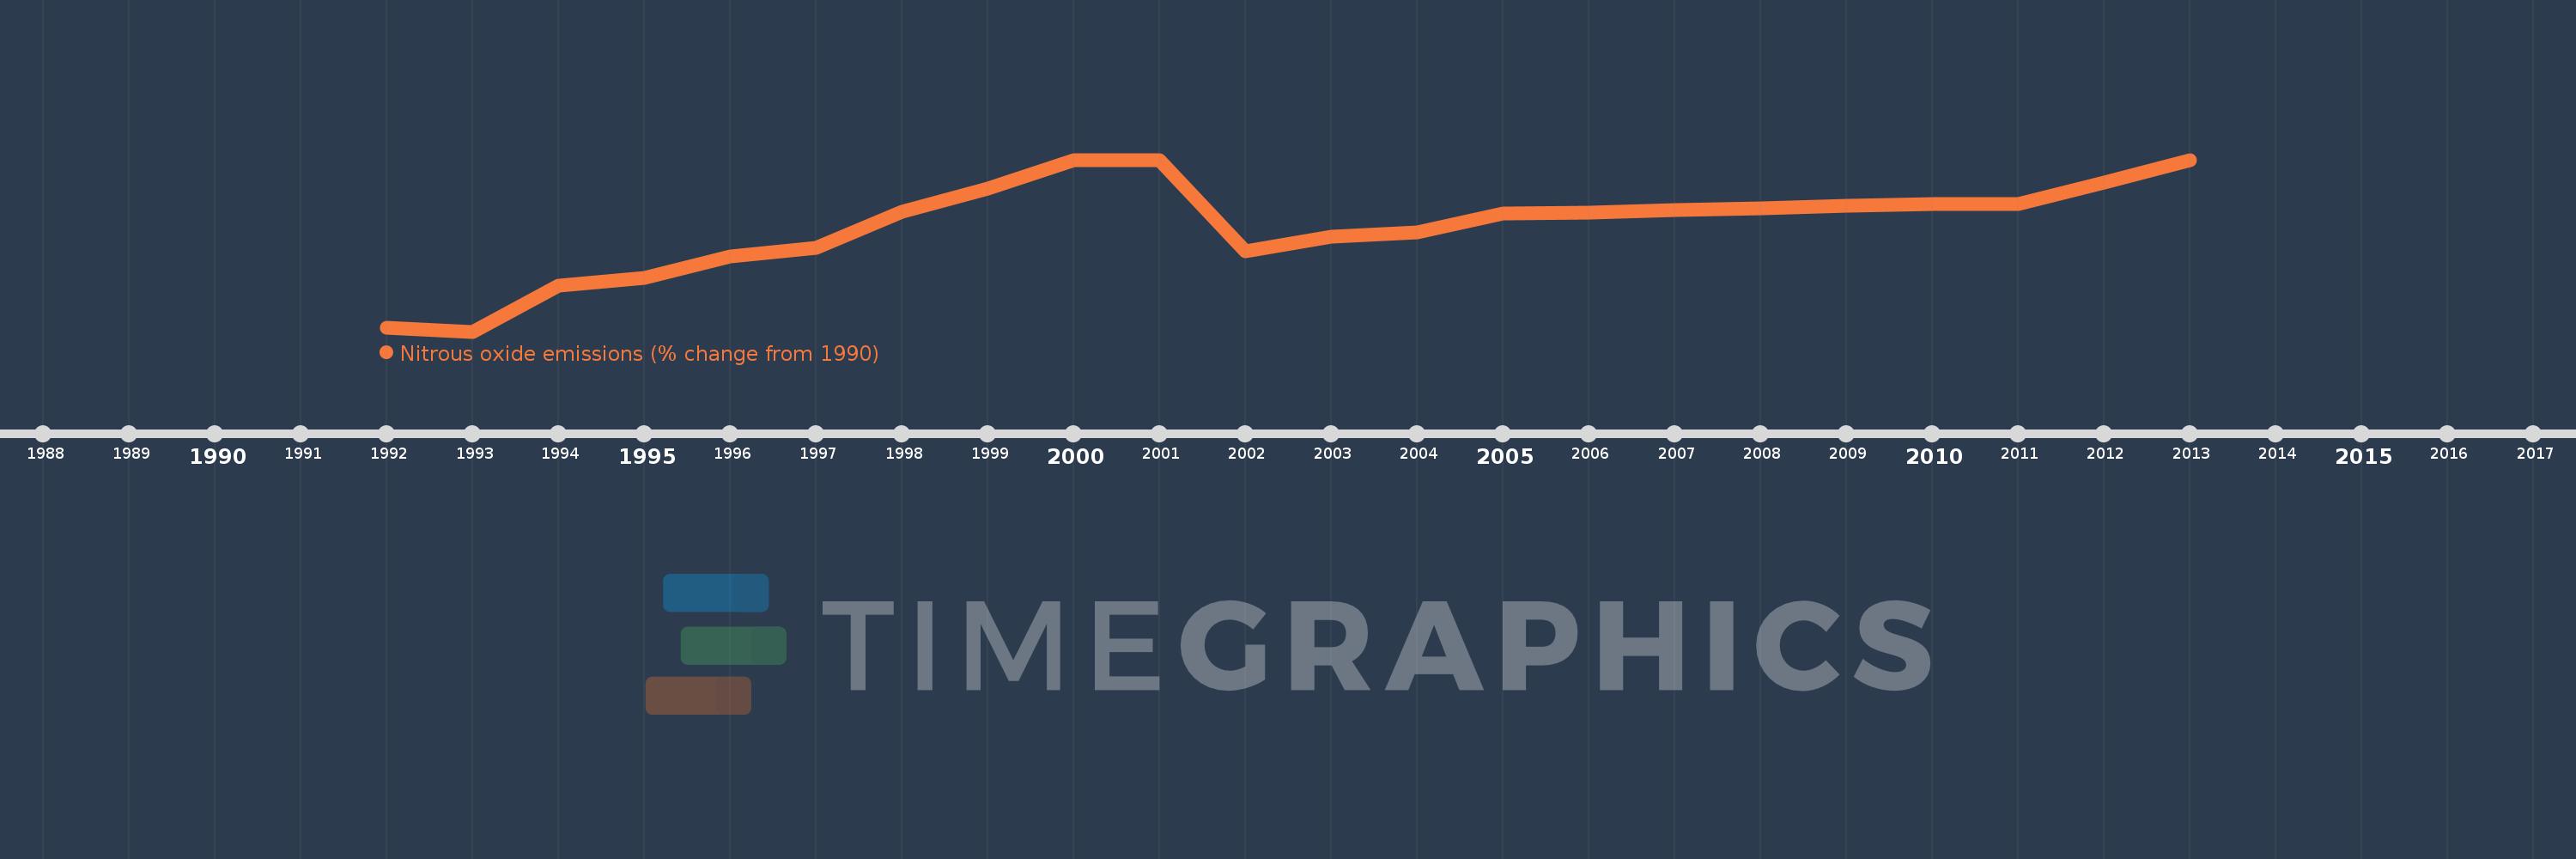
This timeline shows a graph from 1992 to 2013 of Faroe Islands. No data until 1991. Number of actual observations by date: 22.
Source name:
World Development Indicators
Source organization:
World Bank staff estimates from original source: European Commission, Joint Research Centre (JRC)/Netherlands Environmental Assessment Agency (PBL). Emission Database for Global Atmospheric Research (EDGAR): http://edgar.jrc.ec.europa.eu/.
Categories, topics:
Climate Change, Environment
Last updated:
apr 23, 2017
Indicators value changes by year
Meaning:
4.193
Minimum:
-0.892
jan 1, 1993
Maximum:
7.368
jan 1, 2001
At the date of observation
Value
Absolute change
Change from the previous value
jan 1, 1992
-0.692
-0.692
0.0%
jan 1, 1993
-0.892
-0.2
28.88%
jan 1, 1994
1.325
+2.217
-248.59%
jan 1, 1995
1.68
+0.355
26.76%
jan 1, 1996
2.702
+1.022
60.84%
jan 1, 1997
3.128
+0.426
15.78%
jan 1, 1998
4.885
+1.757
56.18%
jan 1, 1999
6.001
+1.115
22.83%
jan 1, 2000
7.331
+1.33
22.16%
jan 1, 2001
7.368
+0.037
0.51%
jan 1, 2002
2.97
-4.398
-59.69%
jan 1, 2003
3.677
+0.707
23.8%
jan 1, 2004
3.895
+0.218
5.93%
jan 1, 2005
4.796
+0.901
23.14%
jan 1, 2006
4.814
+0.018
0.38%
jan 1, 2007
4.94
+0.126
2.62%
jan 1, 2008
5.031
+0.091
1.84%
jan 1, 2009
5.157
+0.126
2.51%
jan 1, 2010
5.257
+0.099
1.93%
jan 1, 2011
5.236
-0.021
-0.4%
jan 1, 2012
6.288
+1.052
20.1%
jan 1, 2013
7.341
+1.052
16.73%
Ranking of countries by current statistics by years