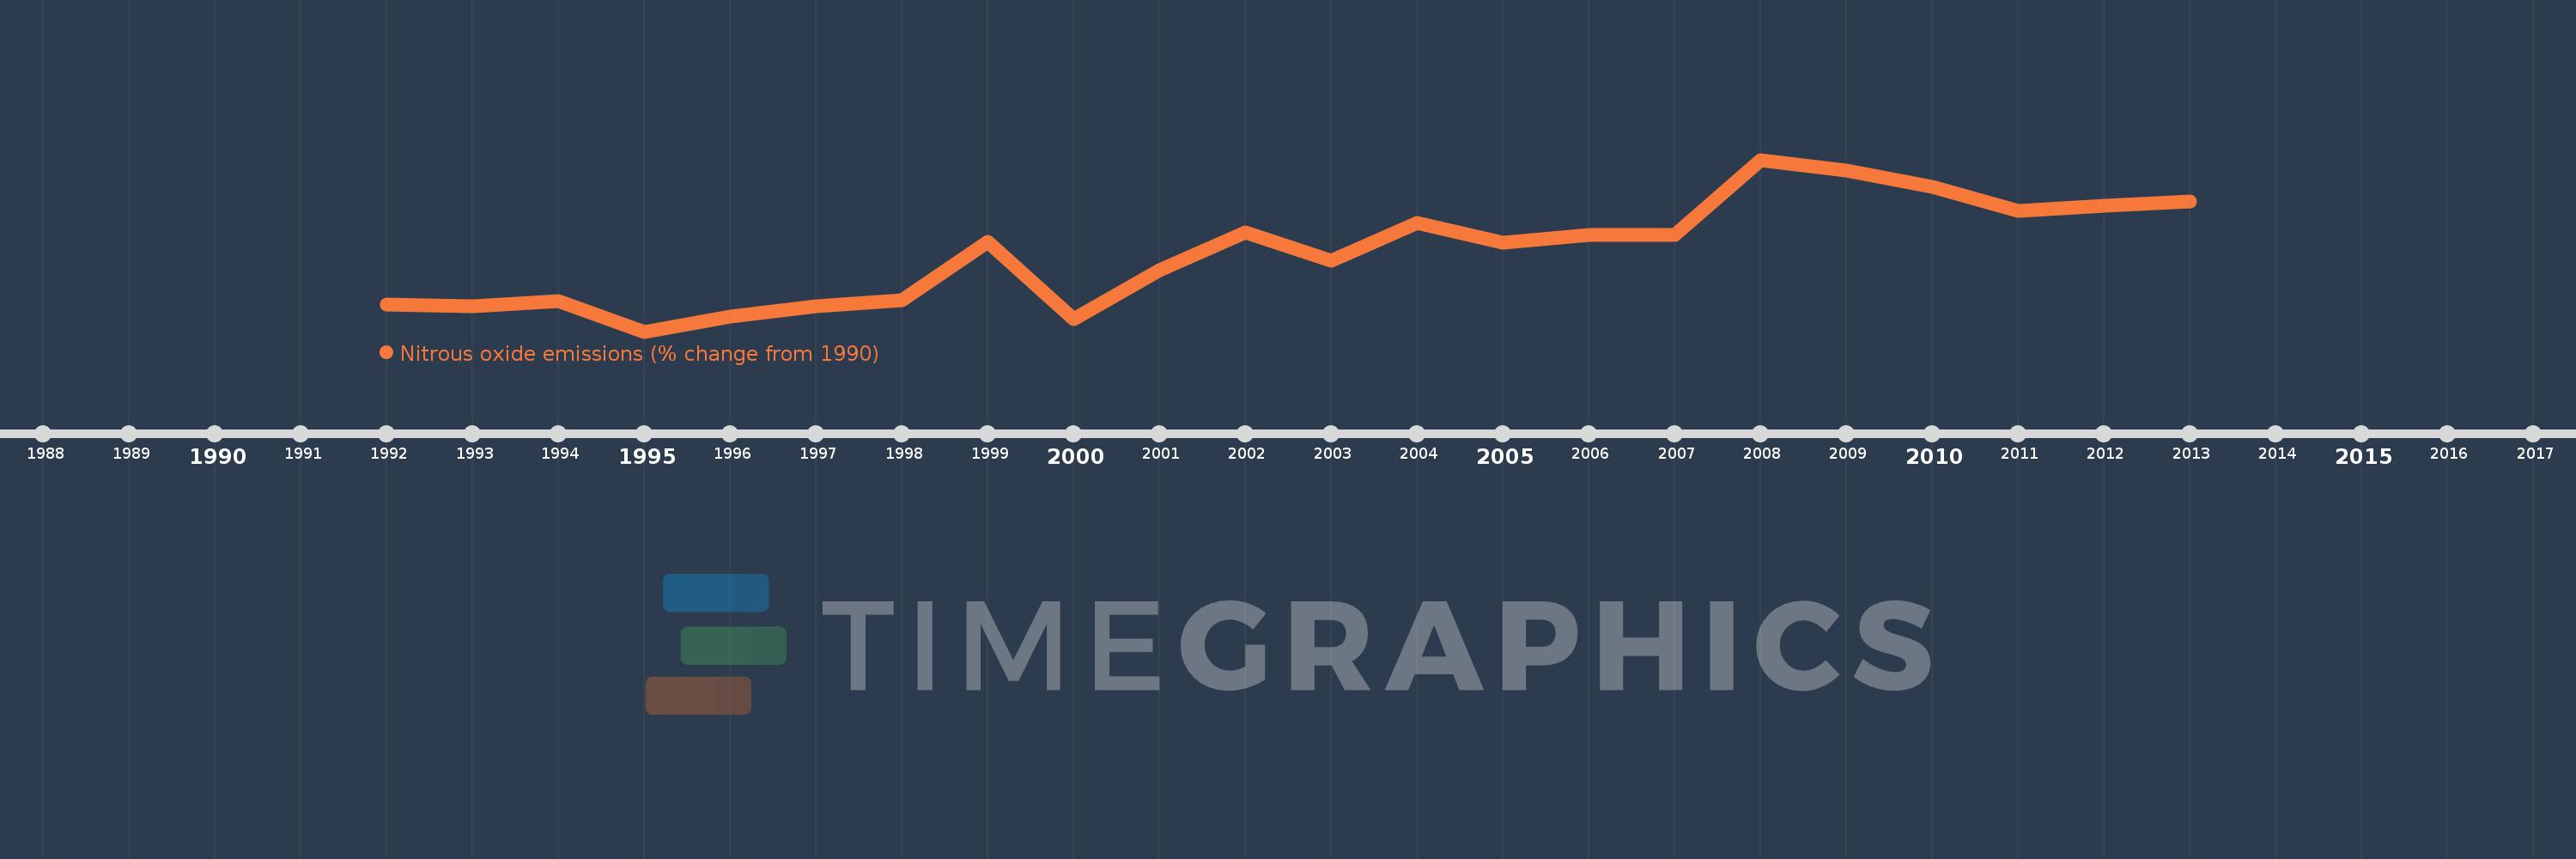
This timeline shows a graph from 1992 to 2013 of Venezuela, RB. No data until 1991. Number of actual observations by date: 22.
Source name:
World Development Indicators
Source organization:
World Bank staff estimates from original source: European Commission, Joint Research Centre (JRC)/Netherlands Environmental Assessment Agency (PBL). Emission Database for Global Atmospheric Research (EDGAR): http://edgar.jrc.ec.europa.eu/.
Categories, topics:
Climate Change, Environment
Last updated:
apr 23, 2017
Indicators value changes by year
Meaning:
14.093
Minimum:
-8.377
jan 1, 1995
Maximum:
40.606
jan 1, 2008
At the date of observation
Value
Absolute change
Change from the previous value
jan 1, 1992
-0.564
-0.564
0.0%
jan 1, 1993
-1.03
-0.467
82.81%
jan 1, 1994
0.252
+1.283
-124.5%
jan 1, 1995
-8.377
-8.629
-3.42K%
jan 1, 1996
-4.03
+4.346
-51.89%
jan 1, 1997
-1.24
+2.79
-69.22%
jan 1, 1998
0.579
+1.819
-146.65%
jan 1, 1999
17.315
+16.736
2.89K%
jan 1, 2000
-4.842
-22.157
-127.96%
jan 1, 2001
9.086
+13.928
-287.67%
jan 1, 2002
19.985
+10.899
119.95%
jan 1, 2003
11.871
-8.114
-40.6%
jan 1, 2004
22.709
+10.837
91.29%
jan 1, 2005
16.906
-5.803
-25.55%
jan 1, 2006
19.141
+2.235
13.22%
jan 1, 2007
19.105
-0.036
-0.19%
jan 1, 2008
40.606
+21.502
112.55%
jan 1, 2009
37.437
-3.17
-7.81%
jan 1, 2010
32.935
-4.501
-12.02%
jan 1, 2011
26.141
-6.795
-20.63%
jan 1, 2012
27.402
+1.261
4.83%
jan 1, 2013
28.664
+1.261
4.6%
Ranking of countries by current statistics by years