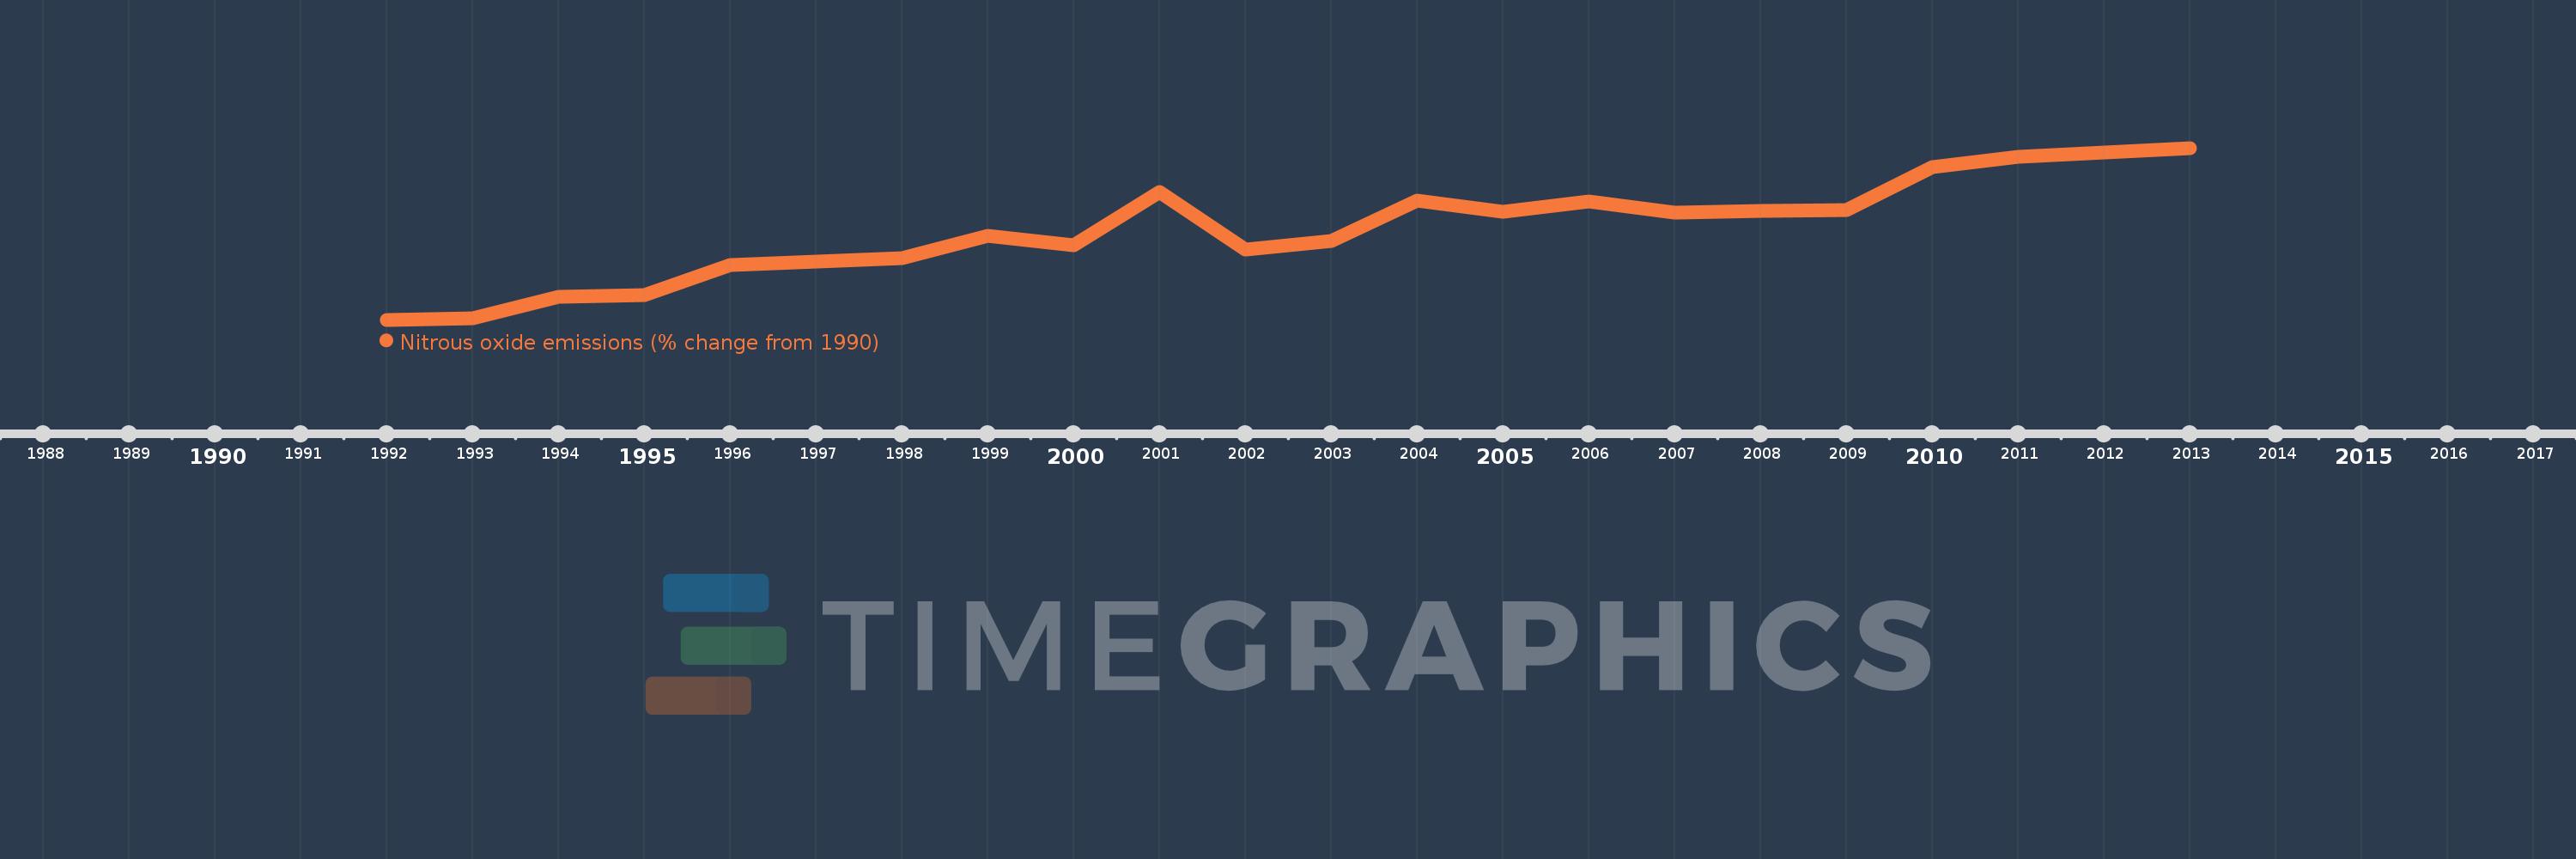
This timeline shows a graph from 1992 to 2013 of Peru. No data until 1991. Number of actual observations by date: 22.
Source name:
World Development Indicators
Source organization:
World Bank staff estimates from original source: European Commission, Joint Research Centre (JRC)/Netherlands Environmental Assessment Agency (PBL). Emission Database for Global Atmospheric Research (EDGAR): http://edgar.jrc.ec.europa.eu/.
Categories, topics:
Climate Change, Environment
Last updated:
apr 23, 2017
Indicators value changes by year
Meaning:
24.861
Minimum:
-4.217
jan 1, 1992
Maximum:
51.148
jan 1, 2013
At the date of observation
Value
Absolute change
Change from the previous value
jan 1, 1992
-4.217
-4.217
0.0%
jan 1, 1993
-3.736
+0.481
-11.4%
jan 1, 1994
3.062
+6.798
-181.97%
jan 1, 1995
3.852
+0.79
25.79%
jan 1, 1996
13.422
+9.57
248.45%
jan 1, 1997
14.581
+1.159
8.63%
jan 1, 1998
15.736
+1.155
7.92%
jan 1, 1999
22.871
+7.135
45.34%
jan 1, 2000
19.726
-3.145
-13.75%
jan 1, 2001
37.07
+17.344
87.92%
jan 1, 2002
18.526
-18.544
-50.02%
jan 1, 2003
21.254
+2.728
14.72%
jan 1, 2004
34.156
+12.902
60.7%
jan 1, 2005
30.631
-3.525
-10.32%
jan 1, 2006
33.838
+3.208
10.47%
jan 1, 2007
30.239
-3.599
-10.64%
jan 1, 2008
30.824
+0.586
1.94%
jan 1, 2009
31.231
+0.407
1.32%
jan 1, 2010
44.883
+13.652
43.71%
jan 1, 2011
48.184
+3.302
7.36%
jan 1, 2012
49.666
+1.482
3.08%
jan 1, 2013
51.148
+1.482
2.98%
Ranking of countries by current statistics by years