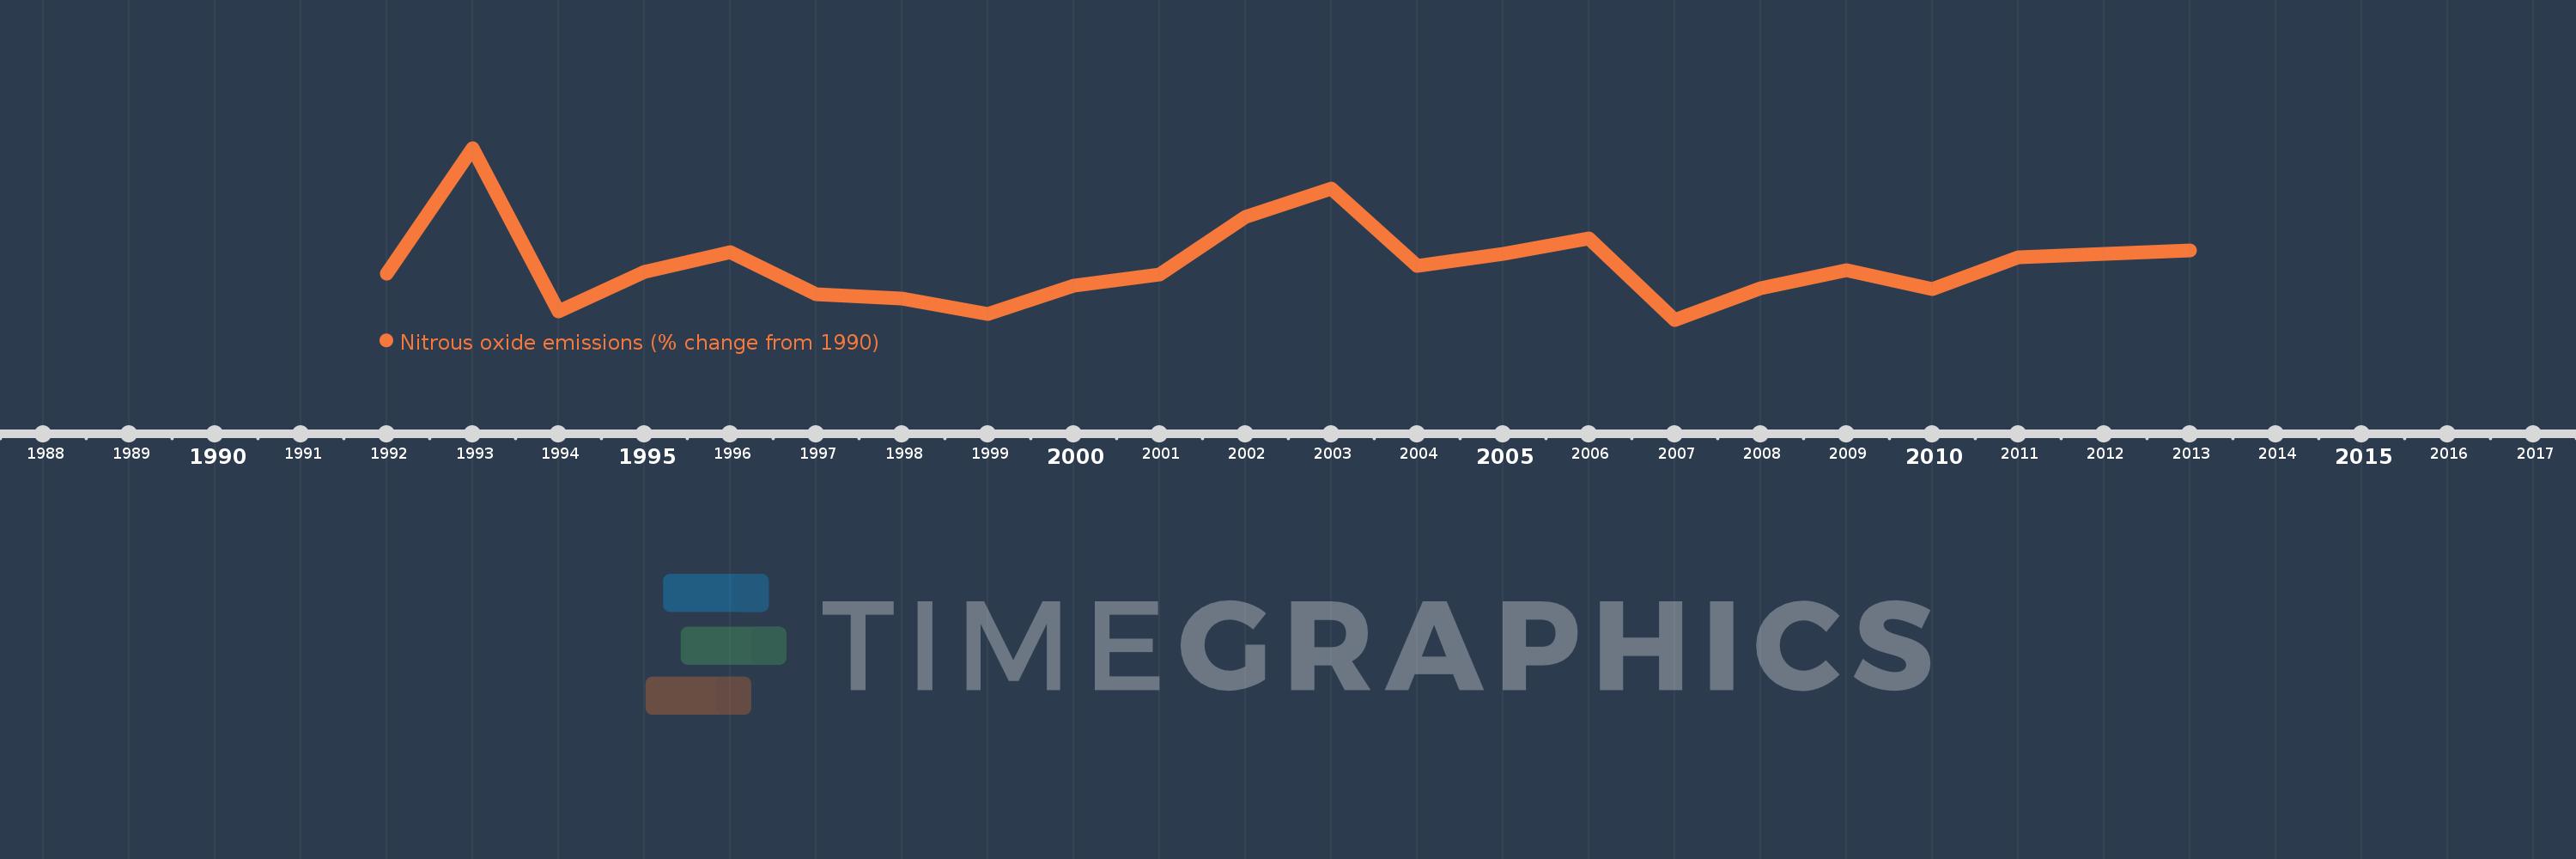
This timeline shows a graph from 1992 to 2013 of Other small states. No data until 1991. Number of actual observations by date: 22.
Source name:
World Development Indicators
Source organization:
World Bank staff estimates from original source: European Commission, Joint Research Centre (JRC)/Netherlands Environmental Assessment Agency (PBL). Emission Database for Global Atmospheric Research (EDGAR): http://edgar.jrc.ec.europa.eu/.
Categories, topics:
Climate Change, Environment
Last updated:
apr 23, 2017
Indicators value changes by year
Meaning:
-12.17
Minimum:
-26.76
jan 1, 2007
Maximum:
18.556
jan 1, 1993
At the date of observation
Value
Absolute change
Change from the previous value
jan 1, 1992
-14.487
-14.487
0.0%
jan 1, 1993
18.556
+33.044
-228.09%
jan 1, 1994
-24.545
-43.101
-232.27%
jan 1, 1995
-14.066
+10.479
-42.69%
jan 1, 1996
-8.926
+5.14
-36.54%
jan 1, 1997
-20.0
-11.074
124.07%
jan 1, 1998
-21.262
-1.261
6.31%
jan 1, 1999
-25.191
-3.93
18.48%
jan 1, 2000
-17.855
+7.336
-29.12%
jan 1, 2001
-14.929
+2.926
-16.39%
jan 1, 2002
0.298
+15.227
-102.0%
jan 1, 2003
7.911
+7.614
2.56K%
jan 1, 2004
-12.661
-20.573
-260.04%
jan 1, 2005
-9.292
+3.369
-26.61%
jan 1, 2006
-5.315
+3.977
-42.8%
jan 1, 2007
-26.76
-21.445
403.51%
jan 1, 2008
-18.493
+8.267
-30.89%
jan 1, 2009
-13.691
+4.802
-25.97%
jan 1, 2010
-18.612
-4.921
35.94%
jan 1, 2011
-10.37
+8.242
-44.28%
jan 1, 2012
-9.474
+0.896
-8.64%
jan 1, 2013
-8.578
+0.896
-9.46%
Ranking of countries by current statistics by years